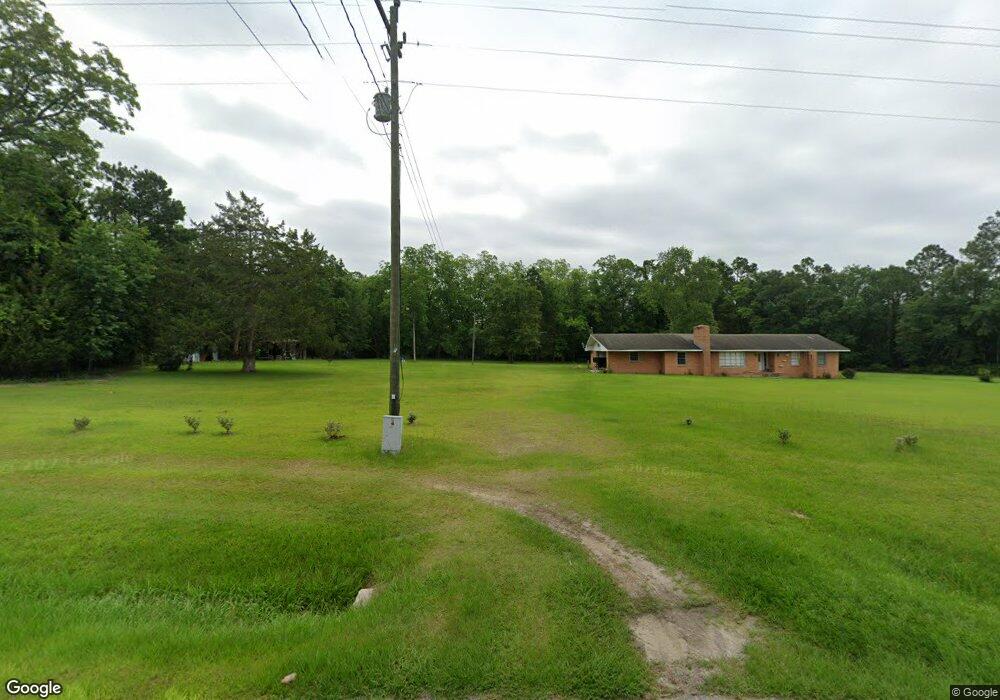
5422 Highway 125 N Nashville, GA 31639
Estimated Value: $121,000
--
Bed
1
Bath
1,980
Sq Ft
$61/Sq Ft
Est. Value
About This Home
This home is located at 5422 Highway 125 N, Nashville, GA 31639 and is currently estimated at $121,000, approximately $61 per square foot. 5422 Highway 125 N is a home located in Berrien County with nearby schools including Berrien Primary School, Berrien Elementary School, and Berrien Middle School.
Ownership History
Date
Name
Owned For
Owner Type
Purchase Details
Closed on
Mar 3, 2023
Sold by
Lee Thomas Brenda
Bought by
Money David P and Money Alison T
Current Estimated Value
Purchase Details
Closed on
Feb 10, 2023
Sold by
Mathis Larry Andrew
Bought by
Mathis Larry Andrew and Gilder Mellissa Sue
Purchase Details
Closed on
Dec 30, 2022
Sold by
Mathis Larry Andrew
Bought by
Lee Thomas Brenda
Purchase Details
Closed on
Nov 16, 2016
Sold by
Irma Latrelle R
Bought by
Mathis Larry Andrew
Purchase Details
Closed on
Aug 5, 2016
Sold by
Irma Latrelle R
Bought by
Lee Thomas Ancil George and Lee Thomas Brenda
Purchase Details
Closed on
Aug 6, 2003
Sold by
Crosby Latrelle
Bought by
Mathis Larry Deborah Mathis and Mathis Br
Purchase Details
Closed on
Mar 19, 1998
Sold by
Richardson Richardson L and Richardson A
Bought by
Crosby Latrelle
Create a Home Valuation Report for This Property
The Home Valuation Report is an in-depth analysis detailing your home's value as well as a comparison with similar homes in the area
Home Values in the Area
Average Home Value in this Area
Purchase History
| Date | Buyer | Sale Price | Title Company |
|---|---|---|---|
| Money David P | -- | -- | |
| Lee Thomas Brenda | -- | -- | |
| Mathis Larry Andrew | -- | -- | |
| Lee Thomas Brenda | -- | -- | |
| Mathis Larry Andrew | -- | -- | |
| Lee Thomas Ancil George | -- | -- | |
| Mathis Larry Deborah Mathis | -- | -- | |
| Crosby Latrelle | -- | -- |
Source: Public Records
Tax History Compared to Growth
Tax History
| Year | Tax Paid | Tax Assessment Tax Assessment Total Assessment is a certain percentage of the fair market value that is determined by local assessors to be the total taxable value of land and additions on the property. | Land | Improvement |
|---|---|---|---|---|
| 2024 | $341 | $20,142 | $20,142 | $0 |
| 2023 | $1,173 | $60,135 | $35,570 | $24,565 |
| 2022 | $1,157 | $60,135 | $35,570 | $24,565 |
| 2021 | $1,149 | $60,135 | $35,570 | $24,565 |
| 2020 | $1,136 | $60,135 | $35,570 | $24,565 |
| 2019 | $1,121 | $60,135 | $35,570 | $24,565 |
| 2018 | $1,853 | $60,135 | $35,570 | $24,565 |
| 2017 | $1,093 | $60,135 | $35,570 | $24,565 |
| 2016 | $1,382 | $79,048 | $50,123 | $28,925 |
| 2015 | -- | $79,435 | $50,510 | $28,925 |
| 2014 | -- | $79,435 | $50,510 | $28,925 |
| 2013 | -- | $90,591 | $50,510 | $40,081 |
Source: Public Records
Map
Nearby Homes
- 4650 Georgia 125
- 349 Sand Ridge Ln
- 8422 Massee Post Rd
- 11010 Barneyville Rd
- 2421 Nashville Enigma Rd
- 1504 Bay Tree Rd
- 12223 Highway 129
- 201 Clyatt Ave
- 501 Hull Ave
- 624 W Washington Ave
- 0 Mclendon Rd
- 713 Pall Mall Place
- 612 W Dennis Ave
- 514 W Mcpherson Ave
- 307 Gaskins St
- 0 Nashville Enigma Rd
- 734 N Jackson St
- 309 S Dogwood Dr
- 102 W Avera Ave
- 703 N Jackson St