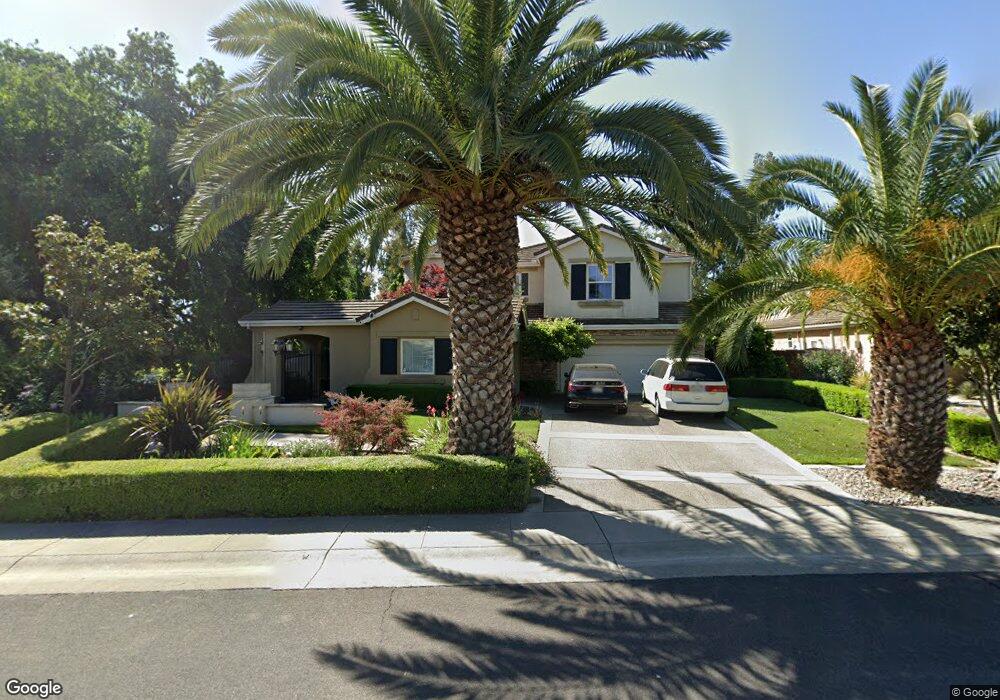
5424 Cowell Blvd Davis, CA 95618
South Davis NeighborhoodEstimated Value: $1,460,000 - $1,698,597
5
Beds
4
Baths
3,545
Sq Ft
$440/Sq Ft
Est. Value
About This Home
This home is located at 5424 Cowell Blvd, Davis, CA 95618 and is currently estimated at $1,558,149, approximately $439 per square foot. 5424 Cowell Blvd is a home located in Yolo County with nearby schools including Pioneer Elementary School, Frances Ellen Watkins Harper Junior High School, and Davis Senior High School.
Ownership History
Date
Name
Owned For
Owner Type
Purchase Details
Closed on
Oct 2, 2007
Sold by
Liu Hong and Zhang Yihua
Bought by
Liu Hong and Zhang Yihua
Current Estimated Value
Purchase Details
Closed on
Oct 3, 2002
Sold by
Warmington Em Associates Lp
Bought by
Liu Hong and Zhang Yihua
Home Financials for this Owner
Home Financials are based on the most recent Mortgage that was taken out on this home.
Original Mortgage
$380,000
Interest Rate
5.99%
Purchase Details
Closed on
Jul 25, 2000
Sold by
White Michael and Michael & Marilyn White Trust
Bought by
Warmington Em Associates Lp
Purchase Details
Closed on
Mar 15, 2000
Sold by
Warmington Em Associates Lp
Bought by
White Michael and White Marilyn
Home Financials for this Owner
Home Financials are based on the most recent Mortgage that was taken out on this home.
Original Mortgage
$179,990
Interest Rate
8.21%
Mortgage Type
Seller Take Back
Create a Home Valuation Report for This Property
The Home Valuation Report is an in-depth analysis detailing your home's value as well as a comparison with similar homes in the area
Home Values in the Area
Average Home Value in this Area
Purchase History
| Date | Buyer | Sale Price | Title Company |
|---|---|---|---|
| Liu Hong | -- | None Available | |
| Liu Hong | $765,000 | Placer Title | |
| Warmington Em Associates Lp | $600,000 | Placer Title Company | |
| White Michael | $600,000 | Placer Title Company |
Source: Public Records
Mortgage History
| Date | Status | Borrower | Loan Amount |
|---|---|---|---|
| Closed | Liu Hong | $380,000 | |
| Previous Owner | White Michael | $179,990 |
Source: Public Records
Tax History Compared to Growth
Tax History
| Year | Tax Paid | Tax Assessment Tax Assessment Total Assessment is a certain percentage of the fair market value that is determined by local assessors to be the total taxable value of land and additions on the property. | Land | Improvement |
|---|---|---|---|---|
| 2025 | $14,492 | $1,107,956 | $427,249 | $680,707 |
| 2023 | $14,492 | $1,064,934 | $410,659 | $654,275 |
| 2022 | $13,966 | $1,044,054 | $402,607 | $641,447 |
| 2021 | $13,699 | $1,023,583 | $394,713 | $628,870 |
| 2020 | $13,459 | $1,013,088 | $390,666 | $622,422 |
| 2019 | $13,052 | $993,224 | $383,006 | $610,218 |
| 2018 | $12,220 | $973,750 | $375,497 | $598,253 |
| 2017 | $12,012 | $954,658 | $368,135 | $586,523 |
| 2016 | $11,760 | $935,940 | $360,917 | $575,023 |
| 2015 | $11,405 | $921,882 | $355,496 | $566,386 |
| 2014 | $11,405 | $903,825 | $348,533 | $555,292 |
Source: Public Records
Map
Nearby Homes
- 5631 Tufts St
- 5039 El Cemonte Ave
- 5033 El Cemonte Ave
- 26894 Middle Golf Dr
- 27243 E El Macero Dr
- 44214 N El Macero Dr
- 44295 S El Macero Dr
- 4606 San Marino Dr
- 4403 Vista Way
- 4306 Vista Way
- 27681 Mace Blvd
- 4138 Cowell Blvd
- 4121 Vista Way
- 4108 Cowell Blvd
- 1540 Pastal Way
- 1408 Santander Ct
- 4007 Nandina Place
- 217 La Vida Way
- 27413 Meadowbrook Dr
- 3423 Verona Terrace