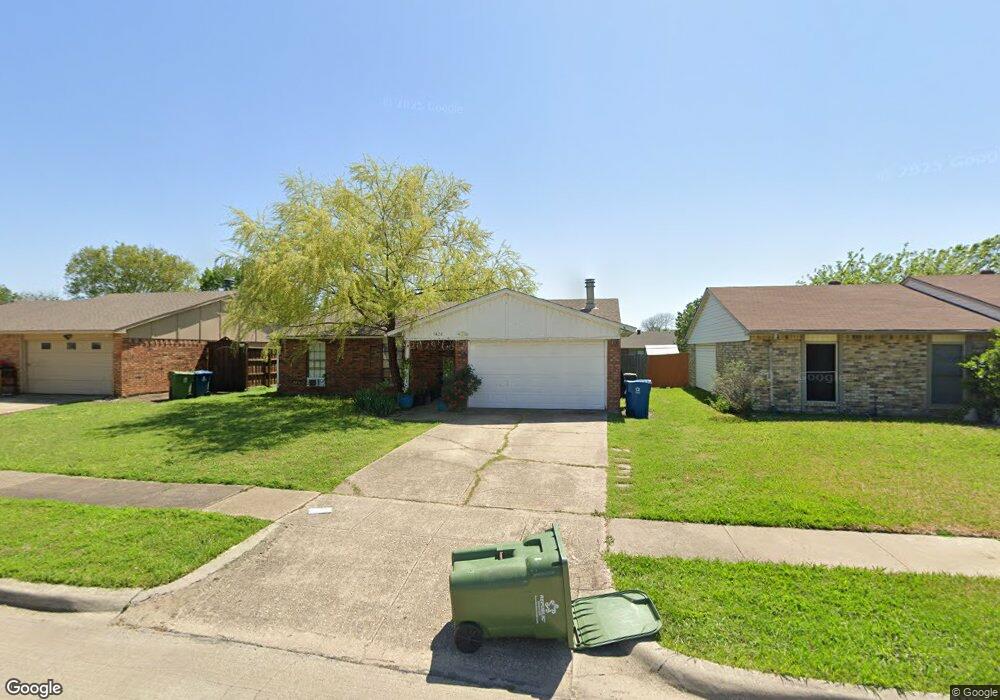
5428 Gibson Dr the Colony, TX 75056
Estimated Value: $294,991 - $332,000
3
Beds
2
Baths
1,339
Sq Ft
$234/Sq Ft
Est. Value
About This Home
This home is located at 5428 Gibson Dr, the Colony, TX 75056 and is currently estimated at $312,748, approximately $233 per square foot. 5428 Gibson Dr is a home located in Denton County with nearby schools including Peters Colony Elementary School, Griffin Middle School, and The Colony High School.
Ownership History
Date
Name
Owned For
Owner Type
Purchase Details
Closed on
Sep 29, 1994
Sold by
Schneider Don A and Schneider Lynn A
Bought by
Cirulis Daniel S
Current Estimated Value
Home Financials for this Owner
Home Financials are based on the most recent Mortgage that was taken out on this home.
Original Mortgage
$45,200
Interest Rate
8.45%
Purchase Details
Closed on
Apr 8, 1994
Sold by
Patton Lisle D
Bought by
Schneider Don A and Schneider Lynn A
Create a Home Valuation Report for This Property
The Home Valuation Report is an in-depth analysis detailing your home's value as well as a comparison with similar homes in the area
Home Values in the Area
Average Home Value in this Area
Purchase History
| Date | Buyer | Sale Price | Title Company |
|---|---|---|---|
| Cirulis Daniel S | -- | -- | |
| Schneider Don A | -- | -- |
Source: Public Records
Mortgage History
| Date | Status | Borrower | Loan Amount |
|---|---|---|---|
| Closed | Cirulis Daniel S | $45,200 |
Source: Public Records
Tax History Compared to Growth
Tax History
| Year | Tax Paid | Tax Assessment Tax Assessment Total Assessment is a certain percentage of the fair market value that is determined by local assessors to be the total taxable value of land and additions on the property. | Land | Improvement |
|---|---|---|---|---|
| 2025 | $5,085 | $244,000 | $66,000 | $178,000 |
| 2024 | $5,085 | $262,000 | $66,000 | $196,000 |
| 2023 | $5,431 | $277,160 | $66,000 | $211,160 |
| 2022 | $5,171 | $246,337 | $66,000 | $180,337 |
| 2021 | $4,276 | $192,000 | $40,854 | $151,146 |
| 2020 | $4,114 | $185,075 | $40,854 | $144,221 |
| 2019 | $3,902 | $170,000 | $40,854 | $129,146 |
| 2018 | $3,512 | $152,000 | $40,854 | $111,146 |
| 2017 | $3,153 | $135,000 | $40,854 | $94,146 |
| 2016 | $2,850 | $122,000 | $23,100 | $98,900 |
| 2015 | $2,204 | $111,945 | $23,100 | $88,845 |
| 2014 | $2,204 | $91,000 | $23,100 | $67,900 |
| 2013 | -- | $81,000 | $23,100 | $57,900 |
Source: Public Records
Map
Nearby Homes