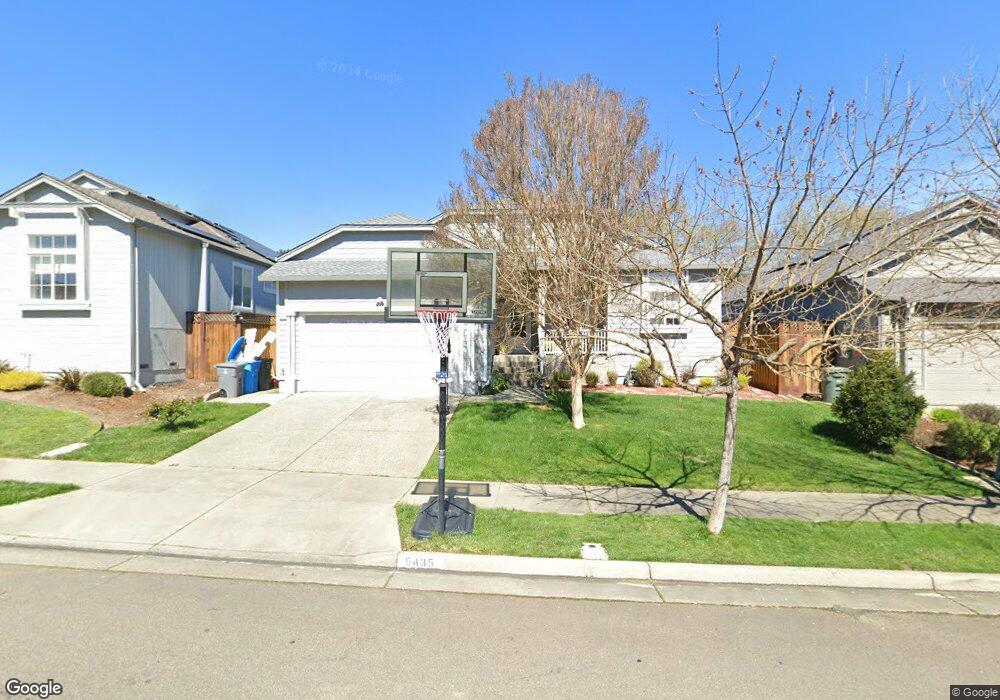
5435 Diane Way Santa Rosa, CA 95409
Skyhawk NeighborhoodEstimated Value: $749,000 - $868,000
3
Beds
2
Baths
1,570
Sq Ft
$515/Sq Ft
Est. Value
About This Home
This home is located at 5435 Diane Way, Santa Rosa, CA 95409 and is currently estimated at $808,103, approximately $514 per square foot. 5435 Diane Way is a home located in Sonoma County with nearby schools including Austin Creek Elementary School, Rincon Valley Middle School, and Maria Carrillo High School.
Ownership History
Date
Name
Owned For
Owner Type
Purchase Details
Closed on
Jun 3, 2014
Sold by
Shah Anish S and Shah Paulomi A
Bought by
Matei Alina and Matei Cristian B
Current Estimated Value
Home Financials for this Owner
Home Financials are based on the most recent Mortgage that was taken out on this home.
Original Mortgage
$476,100
Outstanding Balance
$363,084
Interest Rate
4.27%
Mortgage Type
New Conventional
Estimated Equity
$445,019
Purchase Details
Closed on
Sep 27, 2005
Sold by
Souza Stanley R and Souza Marianne Amelia
Bought by
Shah Anish S and Shah Paulomi A
Home Financials for this Owner
Home Financials are based on the most recent Mortgage that was taken out on this home.
Original Mortgage
$496,800
Interest Rate
5.72%
Mortgage Type
Fannie Mae Freddie Mac
Purchase Details
Closed on
Oct 29, 1998
Sold by
P C Development Lp
Bought by
Souza Stanley R and Souza Marianne Amelia
Home Financials for this Owner
Home Financials are based on the most recent Mortgage that was taken out on this home.
Original Mortgage
$206,322
Interest Rate
6.6%
Create a Home Valuation Report for This Property
The Home Valuation Report is an in-depth analysis detailing your home's value as well as a comparison with similar homes in the area
Home Values in the Area
Average Home Value in this Area
Purchase History
| Date | Buyer | Sale Price | Title Company |
|---|---|---|---|
| Matei Alina | $529,000 | Fidelity National Title Co | |
| Shah Anish S | $621,000 | Fidelity Natl Title Co | |
| Souza Stanley R | $258,000 | North American Title Co |
Source: Public Records
Mortgage History
| Date | Status | Borrower | Loan Amount |
|---|---|---|---|
| Open | Matei Alina | $476,100 | |
| Previous Owner | Shah Anish S | $496,800 | |
| Previous Owner | Souza Stanley R | $206,322 | |
| Closed | Souza Stanley R | $25,790 |
Source: Public Records
Tax History Compared to Growth
Tax History
| Year | Tax Paid | Tax Assessment Tax Assessment Total Assessment is a certain percentage of the fair market value that is determined by local assessors to be the total taxable value of land and additions on the property. | Land | Improvement |
|---|---|---|---|---|
| 2025 | $7,533 | $648,469 | $257,425 | $391,044 |
| 2024 | $7,533 | $635,755 | $252,378 | $383,377 |
| 2023 | $7,533 | $623,290 | $247,430 | $375,860 |
| 2022 | $6,957 | $611,070 | $242,579 | $368,491 |
| 2021 | $6,820 | $599,089 | $237,823 | $361,266 |
| 2020 | $6,796 | $592,947 | $235,385 | $357,562 |
| 2019 | $6,735 | $581,321 | $230,770 | $350,551 |
| 2018 | $6,696 | $569,924 | $226,246 | $343,678 |
| 2017 | $6,575 | $558,750 | $221,810 | $336,940 |
| 2016 | $6,509 | $547,795 | $217,461 | $330,334 |
| 2015 | $6,316 | $539,568 | $214,195 | $325,373 |
| 2014 | $5,670 | $492,000 | $197,000 | $295,000 |
Source: Public Records
Map
Nearby Homes
- 5682 Raters Dr
- 184 El Encanto Way
- 5534 Rainbow Cir
- 5388 Sonoma Hwy
- 5741 Evening Way
- 5426 Spring Lake Ct
- 5088 Firestone Ct
- 5518 Marit Dr
- 5644 Eastlake Dr
- 5056 Fravel Ln
- 5794 Owl Hill Ave
- 5086 Charmian Dr
- 305 Simone Place N
- 5482 Pepperwood Rd
- 206 Indian Creek Dr
- 5569 Pepperwood Rd
- 5550 Pepperwood Rd
- 5020 Roma St
- 5015 Charmian Dr
- 5860 Melita Rd
- 5431 Diane Way
- 5427 Diane Way
- 5443 Diane Way
- 5430 Diane Way
- 5447 Diane Way
- 5423 Diane Way
- 5426 Diane Way
- 5422 Diane Way
- 5451 Diane Way
- 5311 Sonoma Hwy
- 5311 Sonoma Hwy
- 5311 Highway 12 Hwy
- 5315 Highway 12 Hwy
- 5418 Diane Way
- 5684 Evening Way
- 5417 Diane Way
- 5307 Sonoma Hwy
- 5455 Diane Way
- 5432 Sharon St
- 5414 Diane Way