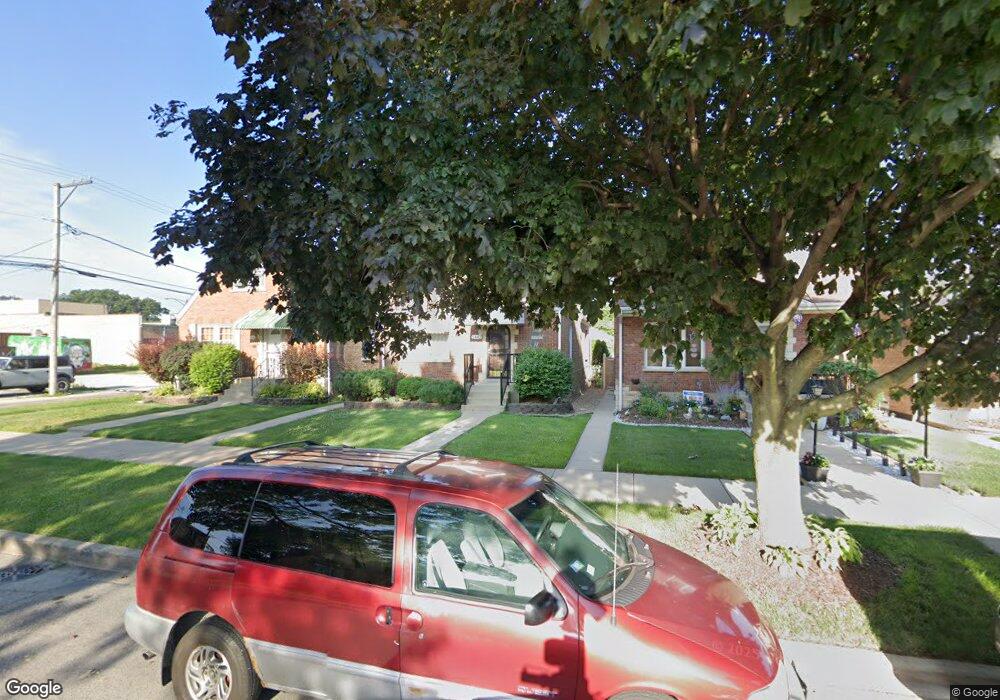
5442 S Newcastle Ave Chicago, IL 60638
Garfield Ridge NeighborhoodEstimated Value: $273,000 - $318,000
2
Beds
1
Bath
744
Sq Ft
$406/Sq Ft
Est. Value
About This Home
This home is located at 5442 S Newcastle Ave, Chicago, IL 60638 and is currently estimated at $302,023, approximately $405 per square foot. 5442 S Newcastle Ave is a home located in Cook County with nearby schools including Byrne Elementary School, Kennedy High School, and St Daniel The Prophet School.
Ownership History
Date
Name
Owned For
Owner Type
Purchase Details
Closed on
Jan 16, 2025
Sold by
Diaz Maria A
Bought by
Chicago Title Land Trust and Trust Number 9002347873
Current Estimated Value
Purchase Details
Closed on
Sep 9, 2024
Sold by
Diaz Edgardo and Garza Laura
Bought by
Diaz Maria A
Purchase Details
Closed on
Oct 19, 2009
Sold by
Sucharski Jacqueline C and Sucharski Stanley A
Bought by
Diaz Edgardo and Garza Laura
Home Financials for this Owner
Home Financials are based on the most recent Mortgage that was taken out on this home.
Original Mortgage
$101,250
Interest Rate
4.96%
Mortgage Type
New Conventional
Purchase Details
Closed on
Nov 3, 1995
Sold by
Sucharski Jacqueline C and Kratowicz Jacqueline C
Bought by
Sucharski Jacqueline C and Sucharski Stanley A
Create a Home Valuation Report for This Property
The Home Valuation Report is an in-depth analysis detailing your home's value as well as a comparison with similar homes in the area
Home Values in the Area
Average Home Value in this Area
Purchase History
| Date | Buyer | Sale Price | Title Company |
|---|---|---|---|
| Chicago Title Land Trust | -- | None Listed On Document | |
| Diaz Maria A | -- | None Listed On Document | |
| Diaz Maria A | -- | None Listed On Document | |
| Diaz Edgardo | $135,000 | Ticor Title Insurance Co | |
| Sucharski Jacqueline C | -- | -- |
Source: Public Records
Mortgage History
| Date | Status | Borrower | Loan Amount |
|---|---|---|---|
| Previous Owner | Diaz Edgardo | $101,250 |
Source: Public Records
Tax History Compared to Growth
Tax History
| Year | Tax Paid | Tax Assessment Tax Assessment Total Assessment is a certain percentage of the fair market value that is determined by local assessors to be the total taxable value of land and additions on the property. | Land | Improvement |
|---|---|---|---|---|
| 2024 | $3,546 | $21,767 | $5,250 | $16,517 |
| 2023 | $3,458 | $16,717 | $4,688 | $12,029 |
| 2022 | $3,458 | $16,717 | $4,688 | $12,029 |
| 2021 | $4,123 | $20,504 | $4,687 | $15,817 |
| 2020 | $3,555 | $15,855 | $3,750 | $12,105 |
| 2019 | $3,896 | $19,267 | $3,750 | $15,517 |
| 2018 | $3,831 | $19,267 | $3,750 | $15,517 |
| 2017 | $2,698 | $12,450 | $3,375 | $9,075 |
| 2016 | $2,510 | $12,450 | $3,375 | $9,075 |
| 2015 | $2,298 | $12,450 | $3,375 | $9,075 |
| 2014 | $2,263 | $12,104 | $3,187 | $8,917 |
| 2013 | $2,219 | $12,104 | $3,187 | $8,917 |
Source: Public Records
Map
Nearby Homes
- 5427 S Newcastle Ave
- 5520 S New England Ave
- 5415 S Oak Park Ave
- 5532 S Oak Park Ave
- 5536 S Normandy Ave
- 5622 S Oak Park Ave
- 5359 S Nordica Ave
- 5605 S Nordica Ave
- 5653 S Normandy Ave
- 5733 S New England Ave
- 5637 S Natoma Ave
- 5148 S Newland Ave
- 5745 S Sayre Ave
- 5137 S Rutherford Ave
- 5820 S Rutherford Ave
- 5326 S Nagle Ave
- 5112 S Nashville Ave
- 5250 S Nagle Ave
- 5402 S 73rd Ave
- 7235 Park Ave
- 5440 S Newcastle Ave
- 5446 S Newcastle Ave
- 5436 S Newcastle Ave
- 5434 S Newcastle Ave
- 5432 S Newcastle Ave
- 6842 W Archer Ave
- 5443 S New England Ave
- 5441 S New England Ave
- 5447 S New England Ave
- 6844 W Archer Ave
- 5428 S Newcastle Ave
- 5439 S New England Ave
- 5435 S New England Ave
- 6850 W Archer Ave
- 6850 W Archer Ave
- 5424 S Newcastle Ave
- 5431 S New England Ave
- 6852 W Archer Ave
- 5445 S Newcastle Ave
- 5441 S Newcastle Ave