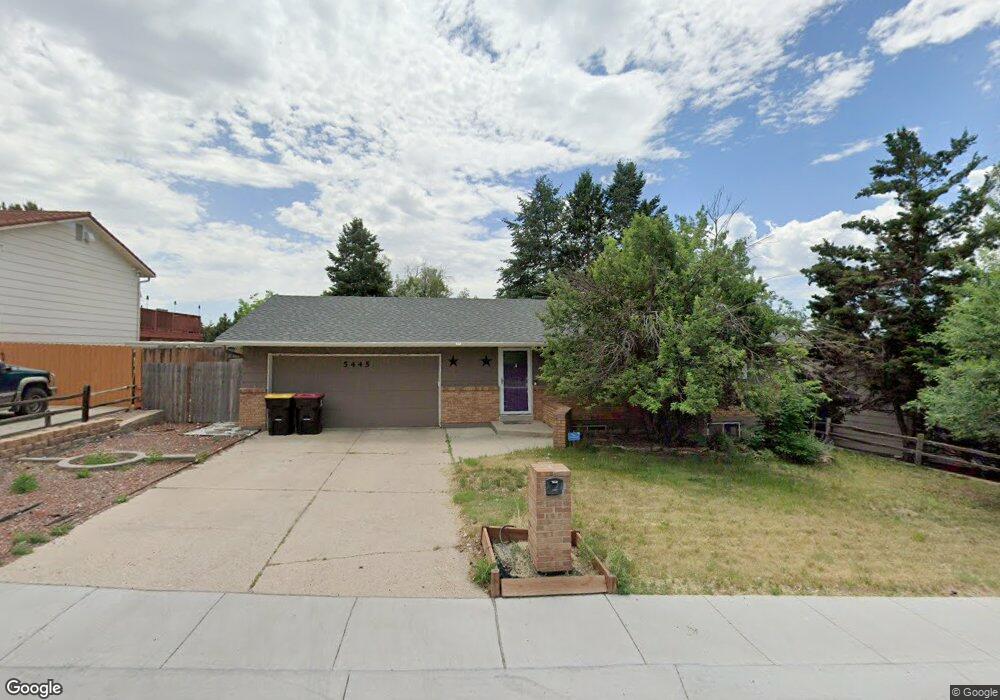
5445 Del Paz Dr Colorado Springs, CO 80918
Vista Grande NeighborhoodEstimated Value: $396,662 - $414,000
2
Beds
2
Baths
910
Sq Ft
$442/Sq Ft
Est. Value
About This Home
This home is located at 5445 Del Paz Dr, Colorado Springs, CO 80918 and is currently estimated at $402,166, approximately $441 per square foot. 5445 Del Paz Dr is a home located in El Paso County with nearby schools including Fremont Elementary School, Russell Middle School, and Doherty High School.
Ownership History
Date
Name
Owned For
Owner Type
Purchase Details
Closed on
Dec 30, 2021
Sold by
Leake Timothy
Bought by
Ramirez Acacia
Current Estimated Value
Purchase Details
Closed on
Jul 10, 2015
Sold by
Service Craig A and Service Melissa A
Bought by
Leake Timothy A and Ramirez Acacia M
Home Financials for this Owner
Home Financials are based on the most recent Mortgage that was taken out on this home.
Original Mortgage
$155,920
Interest Rate
3.91%
Mortgage Type
New Conventional
Purchase Details
Closed on
May 30, 2005
Sold by
Moore Wayne R and Moore Ruby J
Bought by
Service Craig A and Service Melissa A
Home Financials for this Owner
Home Financials are based on the most recent Mortgage that was taken out on this home.
Original Mortgage
$141,600
Interest Rate
5.83%
Mortgage Type
Fannie Mae Freddie Mac
Purchase Details
Closed on
Jun 1, 1980
Bought by
Leake Timothy A
Create a Home Valuation Report for This Property
The Home Valuation Report is an in-depth analysis detailing your home's value as well as a comparison with similar homes in the area
Home Values in the Area
Average Home Value in this Area
Purchase History
| Date | Buyer | Sale Price | Title Company |
|---|---|---|---|
| Ramirez Acacia | -- | -- | |
| Leake Timothy A | $194,900 | Unified Title Company | |
| Service Craig A | $177,000 | Security Title | |
| Leake Timothy A | -- | -- |
Source: Public Records
Mortgage History
| Date | Status | Borrower | Loan Amount |
|---|---|---|---|
| Previous Owner | Leake Timothy A | $155,920 | |
| Previous Owner | Service Craig A | $141,600 | |
| Closed | Service Craig A | $35,400 |
Source: Public Records
Tax History Compared to Growth
Tax History
| Year | Tax Paid | Tax Assessment Tax Assessment Total Assessment is a certain percentage of the fair market value that is determined by local assessors to be the total taxable value of land and additions on the property. | Land | Improvement |
|---|---|---|---|---|
| 2025 | $1,275 | $27,440 | -- | -- |
| 2024 | $1,162 | $27,350 | $4,840 | $22,510 |
| 2022 | $1,108 | $19,800 | $4,300 | $15,500 |
| 2021 | $1,203 | $20,380 | $4,430 | $15,950 |
| 2020 | $1,224 | $18,030 | $3,850 | $14,180 |
| 2019 | $1,217 | $18,030 | $3,850 | $14,180 |
| 2018 | $1,120 | $15,260 | $3,240 | $12,020 |
| 2017 | $1,060 | $15,260 | $3,240 | $12,020 |
| 2016 | $844 | $14,560 | $3,340 | $11,220 |
| 2015 | $841 | $14,560 | $3,340 | $11,220 |
| 2014 | $797 | $13,240 | $3,300 | $9,940 |
Source: Public Records
Map
Nearby Homes
- 5475 Villa Cir
- 2855 El Capitan Dr
- 5140 Villa Cir
- 5139 Villa Cir
- 5127 Galena Dr
- 2775 El Capitan Dr
- 3287 Squaw Valley Dr
- 5510 Galena Dr
- 5341 Fiesta Ln
- 3124 Squaw Valley Dr
- 5015 Bonita Way
- 5165 Crestwood Dr
- 3243 Red Onion Cir
- 2724 Montebello Dr W
- 5030 El Camino Dr Unit 8
- 5030 El Camino Dr Unit 1
- 5034 El Camino Dr Unit 36
- 5034 El Camino Dr Unit 42
- 5034 El Camino Dr Unit 31
- 4911 Sonata Dr
- 5435 Del Paz Dr
- 5455 Del Paz Dr
- 5371 El Camino Ct
- 5425 Del Paz Dr
- 5465 Del Paz Dr
- 5450 Del Paz Dr
- 5367 El Camino Ct
- 5460 Del Paz Dr
- 5470 Del Paz Dr
- 5440 Del Paz Dr
- 5379 El Camino Dr
- 5385 El Camino Ct
- 5475 Del Paz Dr
- 5430 Del Paz Dr
- 5480 Del Paz Dr
- 5450 Villa Cir
- 5363 El Camino Ct
- 5420 Del Paz Dr
- 2981 El Capitan Dr
- 5430 Villa Cir