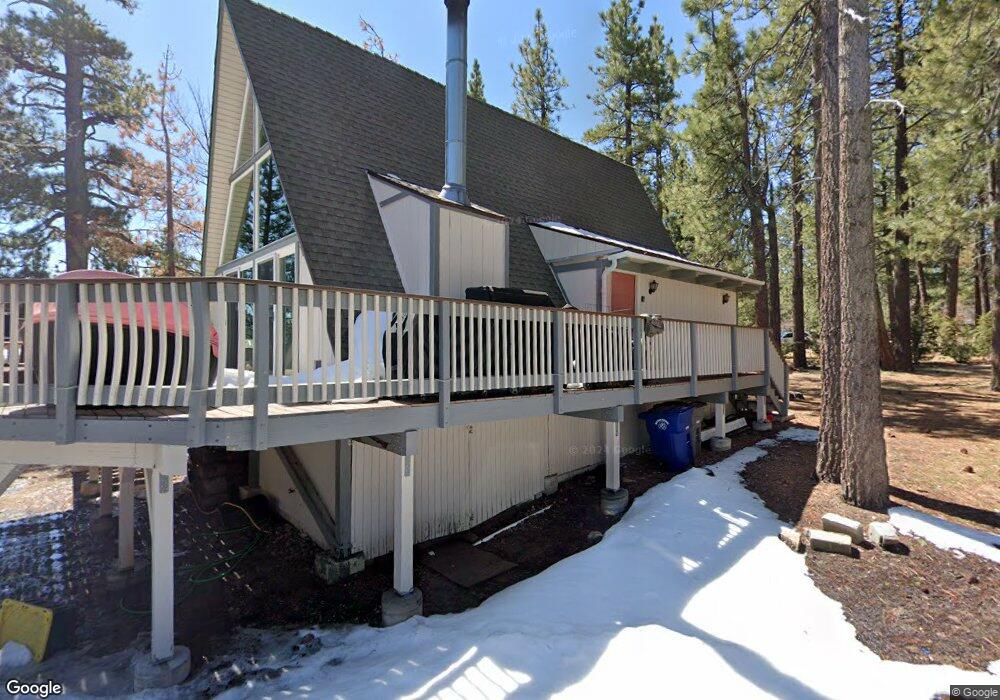
545 Cienega Rd Big Bear Lake, CA 92315
Estimated Value: $485,000 - $609,000
2
Beds
1
Bath
1,152
Sq Ft
$468/Sq Ft
Est. Value
About This Home
This home is located at 545 Cienega Rd, Big Bear Lake, CA 92315 and is currently estimated at $538,948, approximately $467 per square foot. 545 Cienega Rd is a home with nearby schools including Big Bear Middle School and Big Bear High School.
Ownership History
Date
Name
Owned For
Owner Type
Purchase Details
Closed on
Feb 11, 2021
Sold by
Adams Kathryn J and Kathryn J Adams Trust
Bought by
Adams Kathryn J and Kathryn J Adams Trust
Current Estimated Value
Purchase Details
Closed on
May 19, 2005
Sold by
Adams Kathryn J
Bought by
Adams Kathryn J and The Kathryn J Adams Trust
Purchase Details
Closed on
Oct 3, 1997
Sold by
Kinney James E
Bought by
Adams Kathryn J
Home Financials for this Owner
Home Financials are based on the most recent Mortgage that was taken out on this home.
Original Mortgage
$80,000
Outstanding Balance
$12,420
Interest Rate
7.49%
Estimated Equity
$526,528
Purchase Details
Closed on
Sep 15, 1997
Sold by
Nuno Gustavo and Nuno Elia
Bought by
Adams Kathryn J
Home Financials for this Owner
Home Financials are based on the most recent Mortgage that was taken out on this home.
Original Mortgage
$80,000
Outstanding Balance
$12,420
Interest Rate
7.49%
Estimated Equity
$526,528
Create a Home Valuation Report for This Property
The Home Valuation Report is an in-depth analysis detailing your home's value as well as a comparison with similar homes in the area
Home Values in the Area
Average Home Value in this Area
Purchase History
| Date | Buyer | Sale Price | Title Company |
|---|---|---|---|
| Adams Kathryn J | -- | None Available | |
| Adams Kathryn J | -- | -- | |
| Adams Kathryn J | -- | Commonwealth Land Title Co | |
| Adams Kathryn J | $155,000 | Commonwealth Land Title Co |
Source: Public Records
Mortgage History
| Date | Status | Borrower | Loan Amount |
|---|---|---|---|
| Open | Adams Kathryn J | $80,000 |
Source: Public Records
Tax History Compared to Growth
Tax History
| Year | Tax Paid | Tax Assessment Tax Assessment Total Assessment is a certain percentage of the fair market value that is determined by local assessors to be the total taxable value of land and additions on the property. | Land | Improvement |
|---|---|---|---|---|
| 2025 | $3,812 | $247,495 | $127,738 | $119,757 |
| 2024 | $3,812 | $242,642 | $125,233 | $117,409 |
| 2023 | $3,663 | $237,884 | $122,777 | $115,107 |
| 2022 | $3,479 | $233,220 | $120,370 | $112,850 |
| 2021 | $3,364 | $228,647 | $118,010 | $110,637 |
| 2020 | $3,391 | $226,303 | $116,800 | $109,503 |
| 2019 | $3,313 | $221,866 | $114,510 | $107,356 |
| 2018 | $3,204 | $217,516 | $112,265 | $105,251 |
| 2017 | $3,119 | $213,251 | $110,064 | $103,187 |
| 2016 | $3,051 | $209,070 | $107,906 | $101,164 |
| 2015 | $3,025 | $205,929 | $106,285 | $99,644 |
| 2014 | $2,976 | $201,895 | $104,203 | $97,692 |
Source: Public Records
Map
Nearby Homes
- 535 Cienega Rd
- 547 Chipmunk Ln
- 572 Cienega Rd
- 543 Chipmunk Ln
- 612 Timber Ln
- 657 Cienega Rd
- 0 Cienega Unit PW20178991
- 39196 Starview Ln
- 39309 Peak Ln
- 39276 Waterview Dr
- 39298 Willow Landing Rd
- 39243 Crest Ln
- 368 Pulaski Rd
- 368 Pulaski Rd
- 39246 Willow Landing Rd
- 39414 Ruby Ln
- 39124 Waterview Dr
- 39424 Ruby Ln
- 767 Cienega Rd Unit 2
- 39080 Waterview Dr