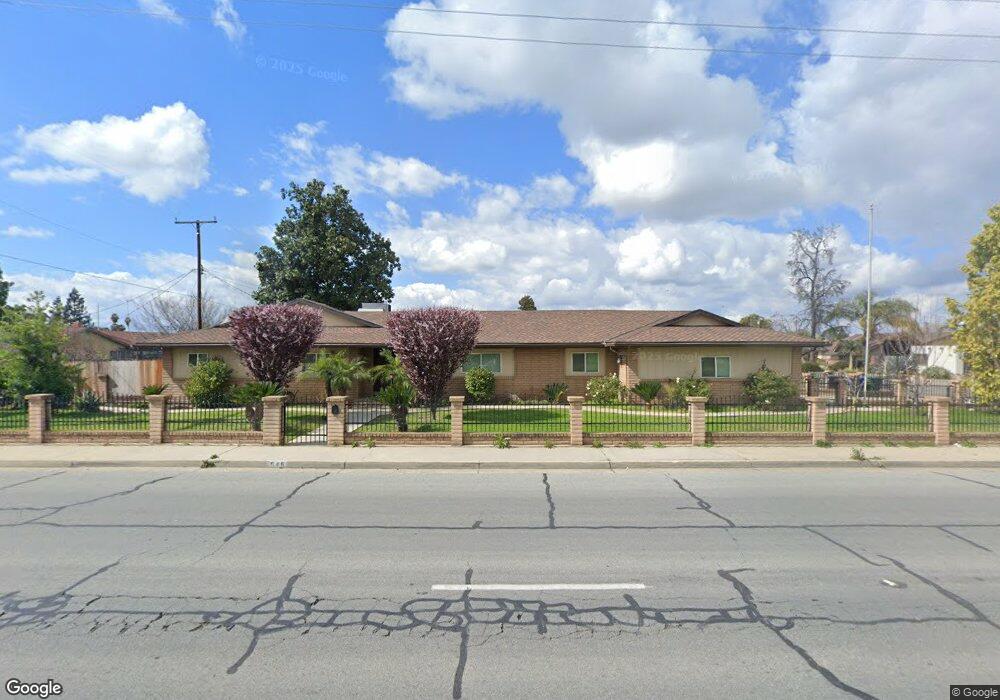
545 N Indiana St Porterville, CA 93257
Porterville Northwest NeighborhoodEstimated Value: $377,000 - $391,853
3
Beds
3
Baths
2,034
Sq Ft
$188/Sq Ft
Est. Value
About This Home
This home is located at 545 N Indiana St, Porterville, CA 93257 and is currently estimated at $381,963, approximately $187 per square foot. 545 N Indiana St is a home located in Tulare County with nearby schools including Monte Vista Elementary School, Strathmore Elementary School, and Sequoia Middle School.
Ownership History
Date
Name
Owned For
Owner Type
Purchase Details
Closed on
Mar 19, 2018
Sold by
Tharp Morris A
Bought by
Meza Jesus G and Beltran-Ortiz Maria G
Current Estimated Value
Home Financials for this Owner
Home Financials are based on the most recent Mortgage that was taken out on this home.
Original Mortgage
$155,901
Outstanding Balance
$133,404
Interest Rate
4.32%
Mortgage Type
New Conventional
Estimated Equity
$248,559
Purchase Details
Closed on
Mar 15, 2018
Sold by
Tharp Morris Allen
Bought by
Meza Jesus Gabriel Payan and Beltran Ortiz Maria Graciela
Home Financials for this Owner
Home Financials are based on the most recent Mortgage that was taken out on this home.
Original Mortgage
$155,901
Outstanding Balance
$133,404
Interest Rate
4.32%
Mortgage Type
New Conventional
Estimated Equity
$248,559
Create a Home Valuation Report for This Property
The Home Valuation Report is an in-depth analysis detailing your home's value as well as a comparison with similar homes in the area
Home Values in the Area
Average Home Value in this Area
Purchase History
| Date | Buyer | Sale Price | Title Company |
|---|---|---|---|
| Meza Jesus G | $156,000 | Chicago Title | |
| Meza Jesus Gabriel Payan | $156,000 | Chicago Title Co |
Source: Public Records
Mortgage History
| Date | Status | Borrower | Loan Amount |
|---|---|---|---|
| Open | Meza Jesus G | $155,901 | |
| Closed | Meza Jesus Gabriel Payan | $155,901 |
Source: Public Records
Tax History Compared to Growth
Tax History
| Year | Tax Paid | Tax Assessment Tax Assessment Total Assessment is a certain percentage of the fair market value that is determined by local assessors to be the total taxable value of land and additions on the property. | Land | Improvement |
|---|---|---|---|---|
| 2025 | $2,719 | $256,008 | $45,511 | $210,497 |
| 2024 | $2,719 | $250,989 | $44,619 | $206,370 |
| 2023 | $2,717 | $246,069 | $43,745 | $202,324 |
| 2022 | $2,633 | $241,245 | $42,888 | $198,357 |
| 2021 | $2,602 | $236,515 | $42,047 | $194,468 |
| 2020 | $2,574 | $234,090 | $41,616 | $192,474 |
| 2019 | $2,528 | $229,500 | $40,800 | $188,700 |
| 2018 | $1,870 | $169,438 | $34,312 | $135,126 |
| 2017 | $1,824 | $166,115 | $33,639 | $132,476 |
| 2016 | $1,750 | $162,857 | $32,979 | $129,878 |
| 2015 | $1,725 | $160,411 | $32,484 | $127,927 |
| 2014 | $1,683 | $157,269 | $31,848 | $125,421 |
Source: Public Records
Map
Nearby Homes
- 824 W Grand Ave
- 816 W Grand Ave
- 670 W Kanai Ave
- 643 W Belleview Ave
- 579 N Villa St
- 347 Ohio Cir
- 572 Memory Ln
- 1060 W Belleview Ave
- 590 W Morton Ave
- 1087 W Belleview Ave
- 474 Douglas St
- 0 W Morton Unit 234694
- 360 N Capitola Ct Unit 4
- 701 Theta Ave
- 701 W Theta Ave
- 293 N Villa St
- 479 W Grand Ave
- 292 N Villa St
- 640 N Prospect St
- 927 Shadowood Place
- 823 W Kanai Ave
- 525 N Indiana St
- 833 W Kanai Ave
- 787 W Kanai Ave
- 820 W Belleview Ave
- 814 W Kanai Ave
- 830 W Belleview Ave
- 790 W Belleview Ave
- 824 W Kanai Ave
- 843 W Kanai Ave
- 775 W Kanai Ave
- 834 W Kanai Ave
- 560 N Indiana St
- 840 W Belleview Ave
- 778 W Belleview Ave
- 844 W Kanai Ave
- 495 N Indiana St
- 776 W Kanai Ave
- 763 W Kanai Ave
- 850 W Belleview Ave