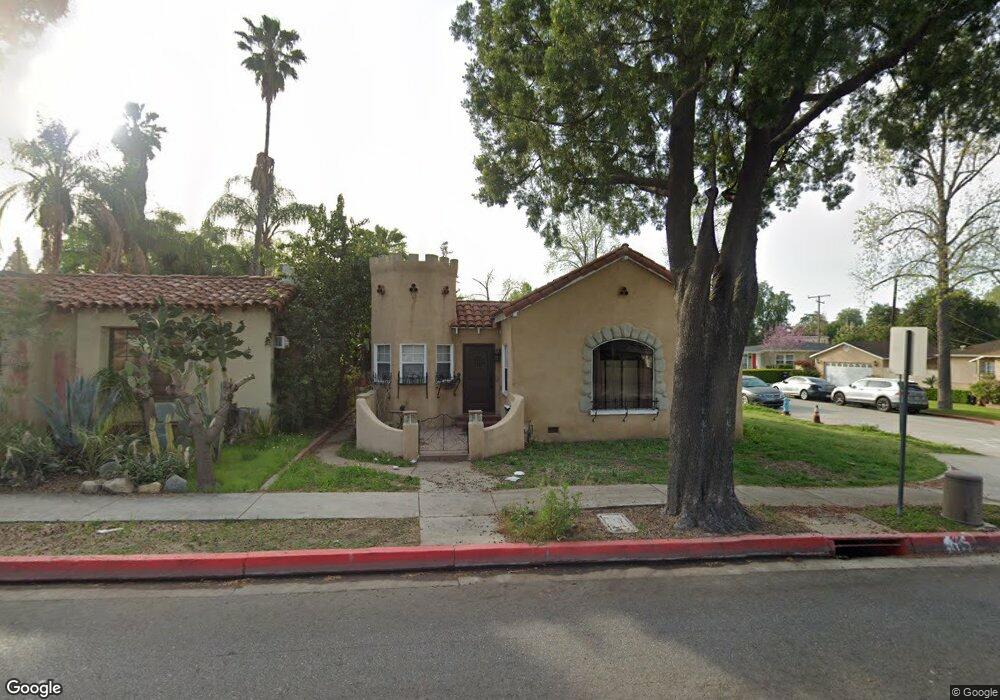
5452 Norwalk Blvd Whittier, CA 90601
West Whittier NeighborhoodEstimated Value: $810,866 - $917,000
3
Beds
1
Bath
1,689
Sq Ft
$500/Sq Ft
Est. Value
About This Home
This home is located at 5452 Norwalk Blvd, Whittier, CA 90601 and is currently estimated at $843,717, approximately $499 per square foot. 5452 Norwalk Blvd is a home located in Los Angeles County with nearby schools including Orange Grove Elementary School, Walter F. Dexter Middle School, and Whittier High School.
Ownership History
Date
Name
Owned For
Owner Type
Purchase Details
Closed on
Dec 15, 2011
Sold by
Barbosa Robert and Barbosa Doreen S
Bought by
Barbosa Robert and Barbosa Doreen S
Current Estimated Value
Home Financials for this Owner
Home Financials are based on the most recent Mortgage that was taken out on this home.
Original Mortgage
$266,153
Outstanding Balance
$181,366
Interest Rate
3.93%
Mortgage Type
New Conventional
Estimated Equity
$662,351
Purchase Details
Closed on
Mar 17, 1995
Sold by
Federal Home Loan Mortgage Corporation
Bought by
Barbosa Robert S and Barbosa Doreen S
Home Financials for this Owner
Home Financials are based on the most recent Mortgage that was taken out on this home.
Original Mortgage
$148,395
Interest Rate
8.44%
Mortgage Type
FHA
Purchase Details
Closed on
Dec 21, 1994
Sold by
Tejada Jose G and Federal Home Loan Mortgage Cor
Bought by
Federal Home Loan Mortgage Corporation
Purchase Details
Closed on
Oct 20, 1994
Sold by
Tejada Jose G
Bought by
Best Western Mtg Corp and Best Western Properties
Create a Home Valuation Report for This Property
The Home Valuation Report is an in-depth analysis detailing your home's value as well as a comparison with similar homes in the area
Home Values in the Area
Average Home Value in this Area
Purchase History
| Date | Buyer | Sale Price | Title Company |
|---|---|---|---|
| Barbosa Robert | -- | Usa National Title Co | |
| Barbosa Robert S | $151,000 | -- | |
| Federal Home Loan Mortgage Corporation | $140,000 | -- | |
| Best Western Mtg Corp | -- | -- |
Source: Public Records
Mortgage History
| Date | Status | Borrower | Loan Amount |
|---|---|---|---|
| Open | Barbosa Robert | $266,153 | |
| Closed | Barbosa Robert S | $148,395 |
Source: Public Records
Tax History Compared to Growth
Tax History
| Year | Tax Paid | Tax Assessment Tax Assessment Total Assessment is a certain percentage of the fair market value that is determined by local assessors to be the total taxable value of land and additions on the property. | Land | Improvement |
|---|---|---|---|---|
| 2025 | $3,415 | $253,601 | $148,133 | $105,468 |
| 2024 | $3,415 | $248,629 | $145,229 | $103,400 |
| 2023 | $3,372 | $243,755 | $142,382 | $101,373 |
| 2022 | $3,310 | $238,977 | $139,591 | $99,386 |
| 2021 | $3,302 | $234,292 | $136,854 | $97,438 |
| 2019 | $3,140 | $227,345 | $132,796 | $94,549 |
| 2018 | $3,025 | $222,889 | $130,193 | $92,696 |
| 2017 | $2,925 | $218,520 | $127,641 | $90,879 |
| 2016 | $2,944 | $214,237 | $125,139 | $89,098 |
| 2015 | $2,867 | $211,020 | $123,260 | $87,760 |
| 2014 | $2,833 | $206,887 | $120,846 | $86,041 |
Source: Public Records
Map
Nearby Homes
- 5518 Norwalk Blvd
- 11511 Beverly Dr
- 5315 Bihr Ct
- 5307 Woodward Ln
- 11302 Maple St
- 10605 Cordoba Ct
- 5115 Castelotte Ct
- 5107 Vista Verde Way
- 11759 S Circle Dr
- 5593 Pioneer Blvd Unit 18
- 5577 Pioneer Blvd Unit 5
- 5903 Redman Ave
- 11905 Mendenhall Ln
- 11840 Nixon Ln
- 12031 Beverly Blvd Unit 1D
- 11273 Dorland Dr
- 10050 Obregon St
- 11447 Broadway Ave
- 10013 Obregon St
- 11232 Dorland Dr
- 5446 Norwalk Blvd
- 10821 Hunter Ave
- 5442 Norwalk Blvd
- 10804 Hunter Ave
- 10827 Hunter Ave
- 5436 Norwalk Blvd
- 5506 Norwalk Blvd
- 10812 Hunter Ave
- 10816 Hunter Ave
- 10820 Hunter Ave
- 10831 Hunter Ave
- 5512 Norwalk Blvd
- 10826 Hunter Ave
- 5416 Norwalk Blvd
- 10837 Hunter Ave
- 10830 Hunter Ave
- 11303 Indiana St
- 10831 Indiana St
- 11309 Indiana St
- 5447 Norwalk Blvd