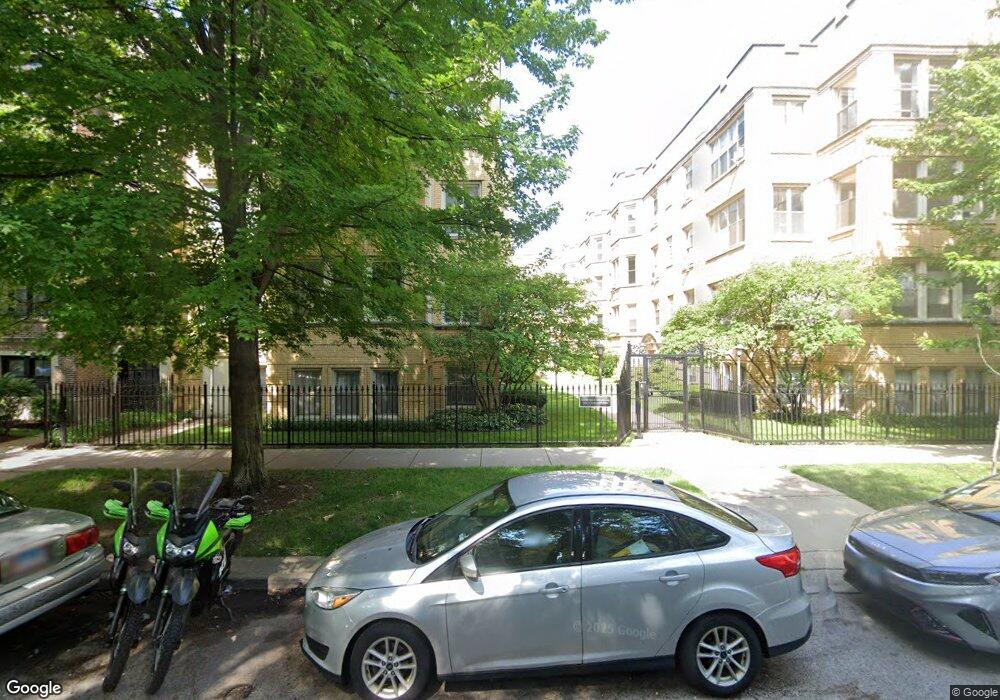
5456 S Cornell Ave Unit 54562W Chicago, IL 60615
Hyde Park NeighborhoodEstimated Value: $161,000 - $214,000
--
Bed
--
Bath
--
Sq Ft
0.51
Acres
About This Home
This home is located at 5456 S Cornell Ave Unit 54562W, Chicago, IL 60615 and is currently estimated at $188,213. 5456 S Cornell Ave Unit 54562W is a home located in Cook County with nearby schools including Harte Elementary School, Kenwood Academy High School, and Akiba-Schechter Jewish Day School.
Ownership History
Date
Name
Owned For
Owner Type
Purchase Details
Closed on
Oct 14, 2021
Sold by
Maor Naama
Bought by
Foster Anthony A and Schnepper Staci
Current Estimated Value
Home Financials for this Owner
Home Financials are based on the most recent Mortgage that was taken out on this home.
Original Mortgage
$100,000
Outstanding Balance
$91,466
Interest Rate
3.01%
Mortgage Type
New Conventional
Estimated Equity
$96,747
Purchase Details
Closed on
Nov 3, 2016
Sold by
Martinez Martin Nicole and Martinez Martin Jodi
Bought by
Maor Naama
Purchase Details
Closed on
Dec 15, 2005
Sold by
5450 & 60 S Cornell Llc
Bought by
Martinez Martin Nicole and Martinez Martin Jodi
Home Financials for this Owner
Home Financials are based on the most recent Mortgage that was taken out on this home.
Original Mortgage
$140,800
Interest Rate
5%
Mortgage Type
Fannie Mae Freddie Mac
Create a Home Valuation Report for This Property
The Home Valuation Report is an in-depth analysis detailing your home's value as well as a comparison with similar homes in the area
Home Values in the Area
Average Home Value in this Area
Purchase History
| Date | Buyer | Sale Price | Title Company |
|---|---|---|---|
| Foster Anthony A | -- | Chicago Title | |
| Maor Naama | $137,000 | Chicago Title | |
| Martinez Martin Nicole | $176,000 | Multiple |
Source: Public Records
Mortgage History
| Date | Status | Borrower | Loan Amount |
|---|---|---|---|
| Open | Foster Anthony A | $100,000 | |
| Previous Owner | Martinez Martin Nicole | $140,800 |
Source: Public Records
Tax History Compared to Growth
Tax History
| Year | Tax Paid | Tax Assessment Tax Assessment Total Assessment is a certain percentage of the fair market value that is determined by local assessors to be the total taxable value of land and additions on the property. | Land | Improvement |
|---|---|---|---|---|
| 2024 | $2,683 | $17,923 | $3,328 | $14,595 |
| 2023 | $3,288 | $15,990 | $2,684 | $13,306 |
| 2022 | $3,288 | $15,990 | $2,684 | $13,306 |
| 2021 | $2,545 | $15,988 | $2,683 | $13,305 |
| 2020 | $2,214 | $13,043 | $2,146 | $10,897 |
| 2019 | $2,165 | $14,203 | $2,146 | $12,057 |
| 2018 | $2,806 | $14,203 | $2,146 | $12,057 |
| 2017 | $2,549 | $11,839 | $1,771 | $10,068 |
| 2016 | $2,371 | $11,839 | $1,771 | $10,068 |
| 2015 | $2,169 | $11,839 | $1,771 | $10,068 |
| 2014 | $1,953 | $10,526 | $1,449 | $9,077 |
| 2013 | $2,291 | $12,594 | $1,449 | $11,145 |
Source: Public Records
Map
Nearby Homes
- 5520 S Cornell Ave Unit 3N
- 5502 S Hyde Park Blvd Unit 1
- 5471 S Hyde Park Blvd Unit 10A
- 5488 S Everett Ave Unit 2
- 5401 S Hyde Park Blvd Unit 1202
- 1700 E 56th St Unit 801
- 1700 E 56th St Unit 310
- 1700 E 56th St Unit 3201
- 1700 E 56th St Unit 3609-3610
- 1452 E Park Place
- 1438 E 55th St
- 5400 S Harper Ave Unit 1401
- 1450 E 55th Place Unit 230S
- 1450 E 55th Place Unit 317S
- 5449 S East View Park Unit 5449
- 1755 E 55th St Unit 1201
- 1755 E 55th St Unit 502
- 1755 E 55th St Unit 1204
- 1755 E 55th St Unit 903
- 1755 E 55th St Unit 301
- 5456 S Cornell Ave Unit 54561W
- 5456 S Cornell Ave Unit 54563W
- 5456 S Cornell Ave Unit 54563E
- 5456 S Cornell Ave Unit 54562E
- 5456 S Cornell Ave Unit 54561E
- 5456 S Cornell Ave Unit 3W
- 5456 S Cornell Ave Unit 3E
- 5456 S Cornell Ave Unit 2W
- 5456 S Cornell Ave Unit 1W
- 5456 S Cornell Ave Unit 1E
- 5456 S Cornell Ave Unit 2E
- 5454 S Cornell Ave Unit 54543W
- 5454 S Cornell Ave Unit 54543E
- 5454 S Cornell Ave Unit 54542W
- 5454 S Cornell Ave Unit 54542E
- 5454 S Cornell Ave Unit 54541W
- 5454 S Cornell Ave Unit 54541E
- 5454 S Cornell Ave Unit 3E
- 5454 S Cornell Ave Unit 2E
- 5454 S Cornell Ave Unit 2W