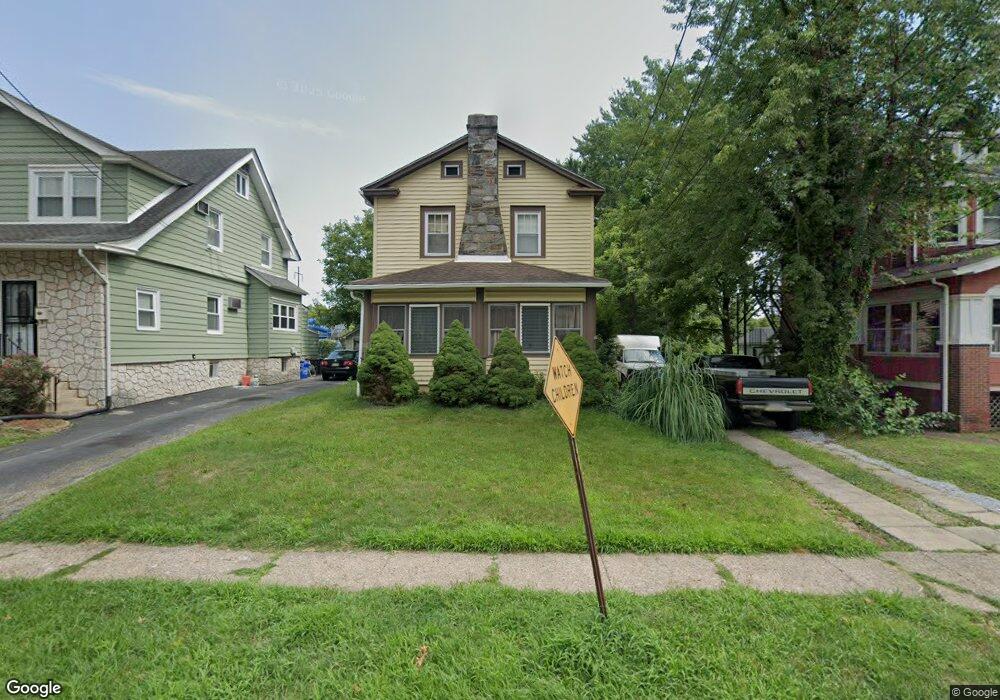
546 13th Ave Prospect Park, PA 19076
Estimated Value: $306,000 - $346,000
3
Beds
2
Baths
1,496
Sq Ft
$214/Sq Ft
Est. Value
About This Home
This home is located at 546 13th Ave, Prospect Park, PA 19076 and is currently estimated at $320,533, approximately $214 per square foot. 546 13th Ave is a home located in Delaware County with nearby schools including Prospect Park School, Interboro Senior High School, and Our Lady Of Fatima School.
Ownership History
Date
Name
Owned For
Owner Type
Purchase Details
Closed on
Jan 10, 2023
Sold by
Costa Miriam
Bought by
Costa Mark and Costa Kelly
Current Estimated Value
Home Financials for this Owner
Home Financials are based on the most recent Mortgage that was taken out on this home.
Original Mortgage
$196,000
Outstanding Balance
$189,805
Interest Rate
6.48%
Estimated Equity
$130,728
Purchase Details
Closed on
Dec 17, 1975
Bought by
Costa Albert and Costa Miriam
Create a Home Valuation Report for This Property
The Home Valuation Report is an in-depth analysis detailing your home's value as well as a comparison with similar homes in the area
Home Values in the Area
Average Home Value in this Area
Purchase History
| Date | Buyer | Sale Price | Title Company |
|---|---|---|---|
| Costa Mark | $245,000 | -- | |
| Costa Mark | $245,000 | None Listed On Document | |
| Costa Albert | -- | -- |
Source: Public Records
Mortgage History
| Date | Status | Borrower | Loan Amount |
|---|---|---|---|
| Open | Costa Mark | $196,000 | |
| Closed | Costa Mark | $196,000 |
Source: Public Records
Tax History Compared to Growth
Tax History
| Year | Tax Paid | Tax Assessment Tax Assessment Total Assessment is a certain percentage of the fair market value that is determined by local assessors to be the total taxable value of land and additions on the property. | Land | Improvement |
|---|---|---|---|---|
| 2025 | $5,544 | $162,200 | $52,550 | $109,650 |
| 2024 | $5,544 | $162,200 | $52,550 | $109,650 |
| 2023 | $5,459 | $162,200 | $52,550 | $109,650 |
| 2022 | $5,365 | $162,200 | $52,550 | $109,650 |
| 2021 | $7,735 | $162,200 | $52,550 | $109,650 |
| 2020 | $5,224 | $99,970 | $33,720 | $66,250 |
| 2019 | $5,217 | $99,970 | $33,720 | $66,250 |
| 2018 | $5,124 | $99,970 | $0 | $0 |
| 2017 | $5,013 | $99,970 | $0 | $0 |
| 2016 | $549 | $99,970 | $0 | $0 |
| 2015 | $560 | $99,970 | $0 | $0 |
| 2014 | $560 | $99,970 | $0 | $0 |
Source: Public Records
Map
Nearby Homes