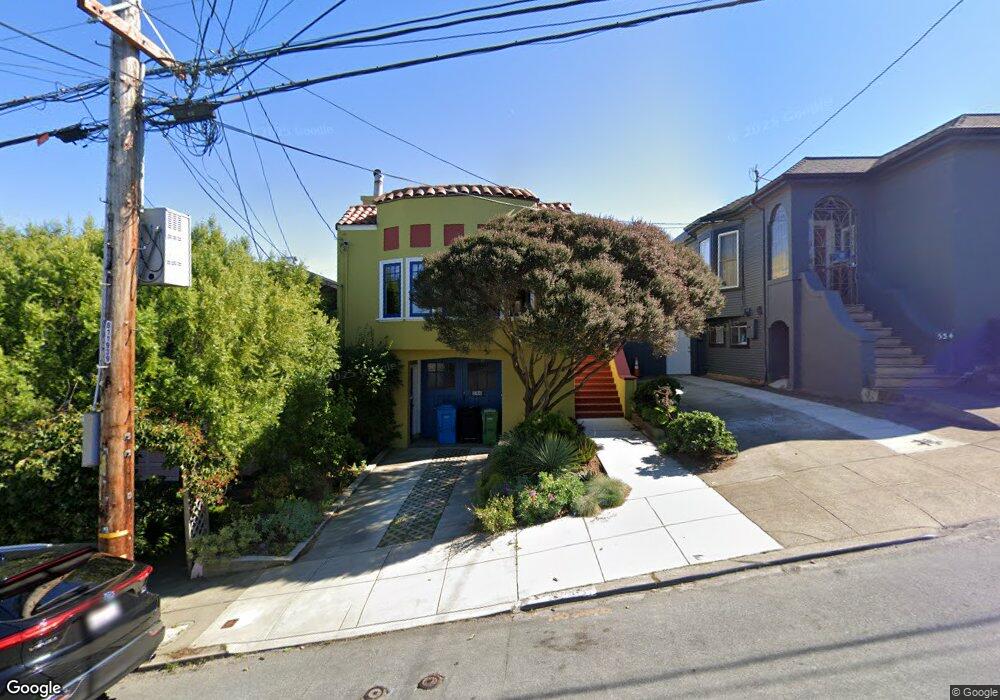
546 Bright St San Francisco, CA 94132
Merced Heights NeighborhoodEstimated Value: $1,055,681 - $1,346,000
2
Beds
1
Bath
1,410
Sq Ft
$837/Sq Ft
Est. Value
About This Home
This home is located at 546 Bright St, San Francisco, CA 94132 and is currently estimated at $1,179,920, approximately $836 per square foot. 546 Bright St is a home located in San Francisco County with nearby schools including Commodore Sloat Elementary School, Aptos Middle School, and Leadership High School.
Ownership History
Date
Name
Owned For
Owner Type
Purchase Details
Closed on
Jul 12, 2010
Sold by
Sims Katherine Mary and Sims Cissy
Bought by
Mentzel Christopher Drue and Lewis Amy Downing
Current Estimated Value
Home Financials for this Owner
Home Financials are based on the most recent Mortgage that was taken out on this home.
Original Mortgage
$432,000
Outstanding Balance
$287,643
Interest Rate
4.76%
Mortgage Type
New Conventional
Estimated Equity
$892,277
Purchase Details
Closed on
Jul 23, 1999
Sold by
Mctigert Walter J and Mctigert Katherine M
Bought by
Sims Cissy
Home Financials for this Owner
Home Financials are based on the most recent Mortgage that was taken out on this home.
Original Mortgage
$197,000
Interest Rate
7.64%
Create a Home Valuation Report for This Property
The Home Valuation Report is an in-depth analysis detailing your home's value as well as a comparison with similar homes in the area
Home Values in the Area
Average Home Value in this Area
Purchase History
| Date | Buyer | Sale Price | Title Company |
|---|---|---|---|
| Mentzel Christopher Drue | $540,000 | Fidelity National Title Co | |
| Sims Cissy | -- | Pacific Coast Title Company |
Source: Public Records
Mortgage History
| Date | Status | Borrower | Loan Amount |
|---|---|---|---|
| Open | Mentzel Christopher Drue | $432,000 | |
| Previous Owner | Sims Cissy | $197,000 | |
| Closed | Sims Cissy | $13,000 |
Source: Public Records
Tax History Compared to Growth
Tax History
| Year | Tax Paid | Tax Assessment Tax Assessment Total Assessment is a certain percentage of the fair market value that is determined by local assessors to be the total taxable value of land and additions on the property. | Land | Improvement |
|---|---|---|---|---|
| 2025 | $8,759 | $691,806 | $484,268 | $207,538 |
| 2024 | $8,759 | $678,244 | $474,774 | $203,470 |
| 2023 | $8,575 | $664,948 | $465,466 | $199,482 |
| 2022 | $8,393 | $651,912 | $456,340 | $195,572 |
| 2021 | $8,241 | $639,132 | $447,394 | $191,738 |
| 2020 | $8,289 | $632,580 | $442,808 | $189,772 |
| 2019 | $8,009 | $620,178 | $434,126 | $186,052 |
| 2018 | $7,740 | $608,018 | $425,614 | $182,404 |
| 2017 | $7,350 | $596,098 | $417,270 | $178,828 |
| 2016 | $7,213 | $584,412 | $409,090 | $175,322 |
| 2015 | $7,122 | $575,636 | $402,946 | $172,690 |
| 2014 | $6,935 | $564,362 | $395,054 | $169,308 |
Source: Public Records
Map
Nearby Homes