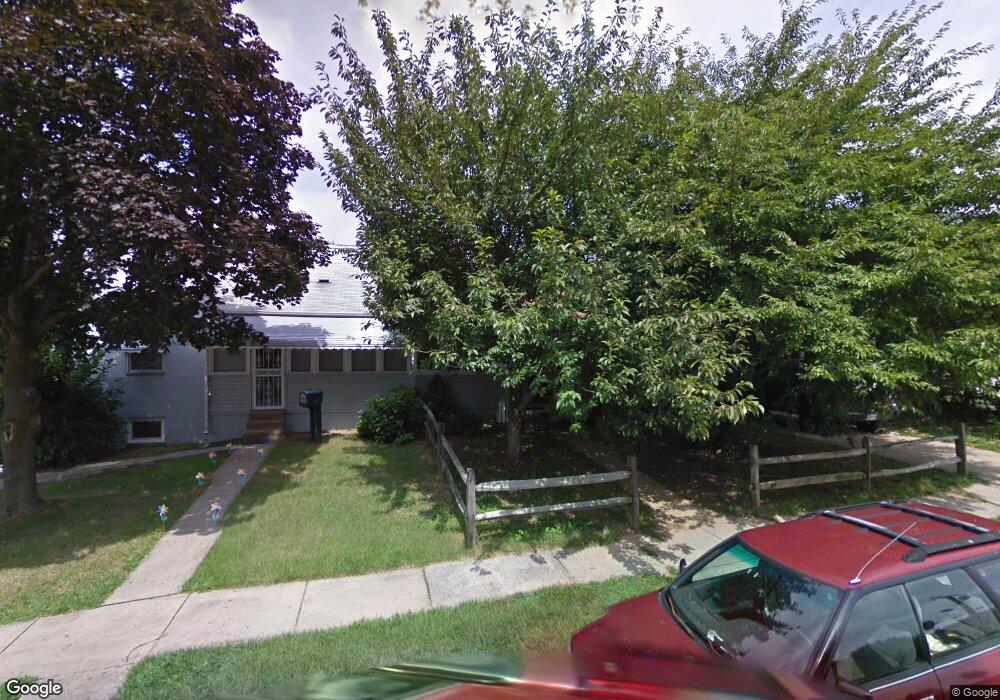
546 Saint Patrick Rd Baltimore, MD 21206
Estimated Value: $155,000 - $201,000
3
Beds
1
Bath
778
Sq Ft
$228/Sq Ft
Est. Value
About This Home
This home is located at 546 Saint Patrick Rd, Baltimore, MD 21206 and is currently estimated at $177,247, approximately $227 per square foot. 546 Saint Patrick Rd is a home located in Baltimore County with nearby schools including Elmwood Elementary School, Parkville Middle & Center of Technology, and Overlea High School.
Ownership History
Date
Name
Owned For
Owner Type
Purchase Details
Closed on
Nov 8, 2023
Sold by
Om O Dynasty Llc
Bought by
Jm Holding Llc
Current Estimated Value
Home Financials for this Owner
Home Financials are based on the most recent Mortgage that was taken out on this home.
Original Mortgage
$80,000
Outstanding Balance
$76,915
Interest Rate
7.57%
Mortgage Type
New Conventional
Estimated Equity
$100,332
Purchase Details
Closed on
Apr 16, 2013
Sold by
Pennymac Corp
Bought by
Equity Trust Company and Kodner David A
Purchase Details
Closed on
Feb 13, 2013
Sold by
Citibank N A
Bought by
Pennymac Corp
Purchase Details
Closed on
Apr 16, 2012
Sold by
Dinatale Victoria
Bought by
Citibank Na
Purchase Details
Closed on
Jan 27, 2004
Sold by
Patterson Mary Elizabeth
Bought by
Dinatale Victoria
Create a Home Valuation Report for This Property
The Home Valuation Report is an in-depth analysis detailing your home's value as well as a comparison with similar homes in the area
Home Values in the Area
Average Home Value in this Area
Purchase History
| Date | Buyer | Sale Price | Title Company |
|---|---|---|---|
| Jm Holding Llc | $120,000 | None Listed On Document | |
| Jm Holding Llc | $120,000 | None Listed On Document | |
| Equity Trust Company | $38,500 | Gemini Title & Escrow Llc | |
| Pennymac Corp | $132,500 | Gemini Title & Escrow Llc | |
| Citibank Na | $79,256 | None Available | |
| Dinatale Victoria | $80,250 | -- | |
| Dinatale Victoria | $80,250 | -- |
Source: Public Records
Mortgage History
| Date | Status | Borrower | Loan Amount |
|---|---|---|---|
| Open | Jm Holding Llc | $80,000 | |
| Closed | Jm Holding Llc | $80,000 |
Source: Public Records
Tax History Compared to Growth
Tax History
| Year | Tax Paid | Tax Assessment Tax Assessment Total Assessment is a certain percentage of the fair market value that is determined by local assessors to be the total taxable value of land and additions on the property. | Land | Improvement |
|---|---|---|---|---|
| 2025 | $1,752 | $113,433 | -- | -- |
| 2024 | $1,752 | $105,667 | $0 | $0 |
| 2023 | $1,650 | $97,900 | $50,000 | $47,900 |
| 2022 | $1,870 | $97,167 | $0 | $0 |
| 2021 | $6,165 | $96,433 | $0 | $0 |
| 2020 | $6,165 | $95,700 | $50,000 | $45,700 |
| 2019 | $3,531 | $94,167 | $0 | $0 |
| 2018 | $1,688 | $92,633 | $0 | $0 |
| 2017 | $1,649 | $91,100 | $0 | $0 |
| 2016 | $2,174 | $91,100 | $0 | $0 |
| 2015 | $2,174 | $91,100 | $0 | $0 |
| 2014 | $2,174 | $95,300 | $0 | $0 |
Source: Public Records
Map
Nearby Homes
- 626 Dale Ave
- 615 Old Home Rd
- 702 Dale Ave
- 501 Dale Ave
- 713 Dale Ave
- 4513 Kenwood Ave
- 400 Dale Ave
- 4603H Kenwood Ave
- 4507 Kenwood Ave
- 4605 Kenwood Ave
- 5944 Clayton Ave
- 4315 Belmar Ave
- 4510 Forest View Ave
- 5912 Daybreak Terrace
- 4517 Springwood Ave
- 4401 Glenmore Ave
- 301 3rd St
- 4232 Belmar Ave
- 5912 Clayton Ave
- 4433 Raspe Ave
- 544 Saint Patrick Rd
- 600 Dale Ave
- 542 Saint Patrick Rd
- 601 Dale Ave
- 538 Dale Ave
- 541 Dale Ave
- 603 Dale Ave
- 604 Dale Ave
- 539 Dale Ave
- 543 Saint Patrick Rd
- 537 Dale Ave
- 540 Saint Patrick Rd
- 606 Dale Ave
- 536 Dale Ave
- 4701 Meise Dr
- 605 Dale Ave
- 608 Dale Ave
- 541 Saint Patrick Rd
- 4700 Mawani Rd
- 534 Dale Ave