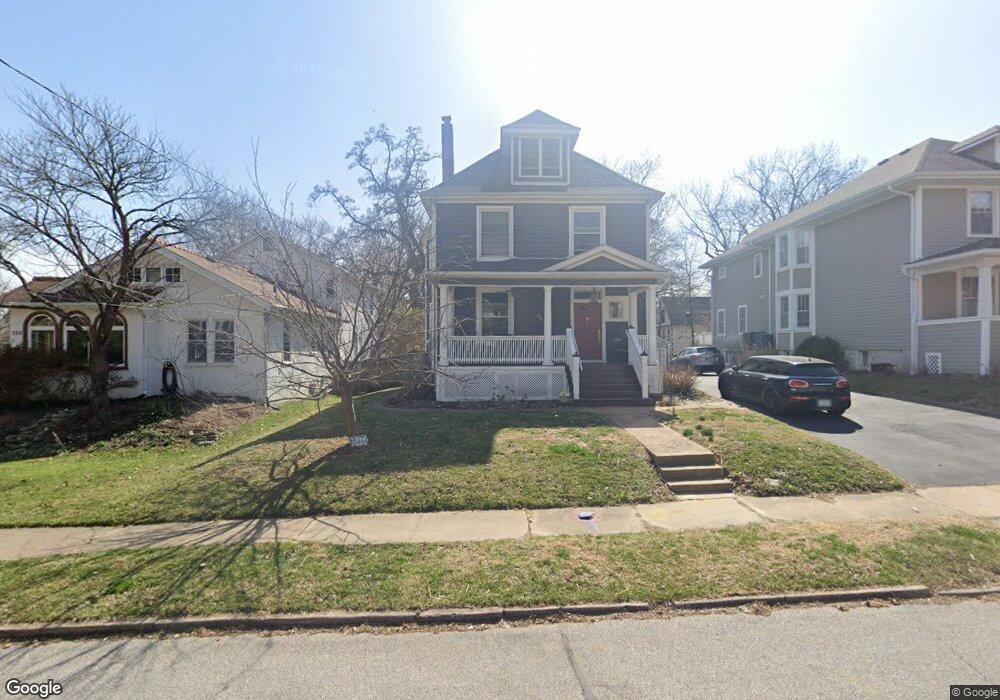
546 Sunnyside Ave Saint Louis, MO 63119
Estimated Value: $658,000 - $879,000
3
Beds
3
Baths
2,544
Sq Ft
$302/Sq Ft
Est. Value
About This Home
This home is located at 546 Sunnyside Ave, Saint Louis, MO 63119 and is currently estimated at $768,417, approximately $302 per square foot. 546 Sunnyside Ave is a home located in St. Louis County with nearby schools including Bristol Elementary School, Hixson Middle School, and Webster Groves High School.
Ownership History
Date
Name
Owned For
Owner Type
Purchase Details
Closed on
Aug 30, 2007
Sold by
Demare George and Demare London
Bought by
Bent Stephen M and Bent Christine C
Current Estimated Value
Home Financials for this Owner
Home Financials are based on the most recent Mortgage that was taken out on this home.
Original Mortgage
$231,000
Outstanding Balance
$146,706
Interest Rate
6.72%
Mortgage Type
Purchase Money Mortgage
Estimated Equity
$621,711
Purchase Details
Closed on
Jul 12, 2000
Sold by
White Cyrus N and White Cynthia S
Bought by
Demare George and Demare London
Home Financials for this Owner
Home Financials are based on the most recent Mortgage that was taken out on this home.
Original Mortgage
$225,200
Interest Rate
7.5%
Purchase Details
Closed on
Jun 13, 1997
Sold by
Fulda Edward J and Fulda Elise H
Bought by
White Cyrus N and White Cynthia S
Home Financials for this Owner
Home Financials are based on the most recent Mortgage that was taken out on this home.
Original Mortgage
$179,120
Interest Rate
7.93%
Create a Home Valuation Report for This Property
The Home Valuation Report is an in-depth analysis detailing your home's value as well as a comparison with similar homes in the area
Home Values in the Area
Average Home Value in this Area
Purchase History
| Date | Buyer | Sale Price | Title Company |
|---|---|---|---|
| Bent Stephen M | $445,000 | Clt | |
| Demare George | $281,500 | -- | |
| White Cyrus N | -- | -- |
Source: Public Records
Mortgage History
| Date | Status | Borrower | Loan Amount |
|---|---|---|---|
| Open | Bent Stephen M | $231,000 | |
| Previous Owner | Demare George | $225,200 | |
| Previous Owner | White Cyrus N | $179,120 |
Source: Public Records
Tax History Compared to Growth
Tax History
| Year | Tax Paid | Tax Assessment Tax Assessment Total Assessment is a certain percentage of the fair market value that is determined by local assessors to be the total taxable value of land and additions on the property. | Land | Improvement |
|---|---|---|---|---|
| 2025 | $8,072 | $135,790 | $61,730 | $74,060 |
| 2024 | $8,072 | $116,380 | $38,590 | $77,790 |
| 2023 | $8,072 | $116,380 | $38,590 | $77,790 |
| 2022 | $6,570 | $88,290 | $30,890 | $57,400 |
| 2021 | $6,548 | $88,290 | $30,890 | $57,400 |
| 2020 | $6,729 | $84,550 | $30,890 | $53,660 |
| 2019 | $5,959 | $75,350 | $30,890 | $44,460 |
| 2018 | $5,467 | $61,350 | $21,620 | $39,730 |
| 2017 | $5,430 | $61,350 | $21,620 | $39,730 |
| 2016 | $5,738 | $62,080 | $18,530 | $43,550 |
| 2015 | $5,767 | $62,080 | $18,530 | $43,550 |
| 2014 | $6,294 | $65,950 | $13,550 | $52,400 |
Source: Public Records
Map
Nearby Homes
- 400 Marion Ave
- 450 E Lockwood Ave Unit 303
- 7826 Grove Ave
- 544 Summit Ave
- 441 Park Rd
- 808 Greeley Ave
- 619 N Bompart Ave
- 946 Newport Ave
- 610 Cornelia Ave
- 716 Clark Ave
- 8361 Big Bend Blvd
- 4 Saint Charles Place
- 6 Saint Charles Place
- 25 Saint Charles Place
- 5000 Wilshusen Ave
- 7723 Suffolk Ave
- 554 N Laclede Station Rd
- 570 N Laclede Station Rd
- 7729 Kenridge Ln
- 717 Yale Ave
- 542 Sunnyside Ave
- 538 Sunnyside Ave
- 121 Summit Ave
- 0Lots1-16 Sunnyside Ave
- 130 Summit Ave
- 122 Summit Ave
- 530 Sunnyside Ave
- 120 Summit Ave
- 545 Sunnyside Ave
- 119 Summit Ave
- 118 Summit Ave
- 549 Sunnyside Ave
- 541 Sunnyside Ave
- 553 Sunnyside Ave
- 526 Sunnyside Ave
- 533 Sunnyside Ave
- 106 Summit Ave
- 529 Sunnyside Ave
- 522 Sunnyside Ave
- 608 Sunnyside Ave