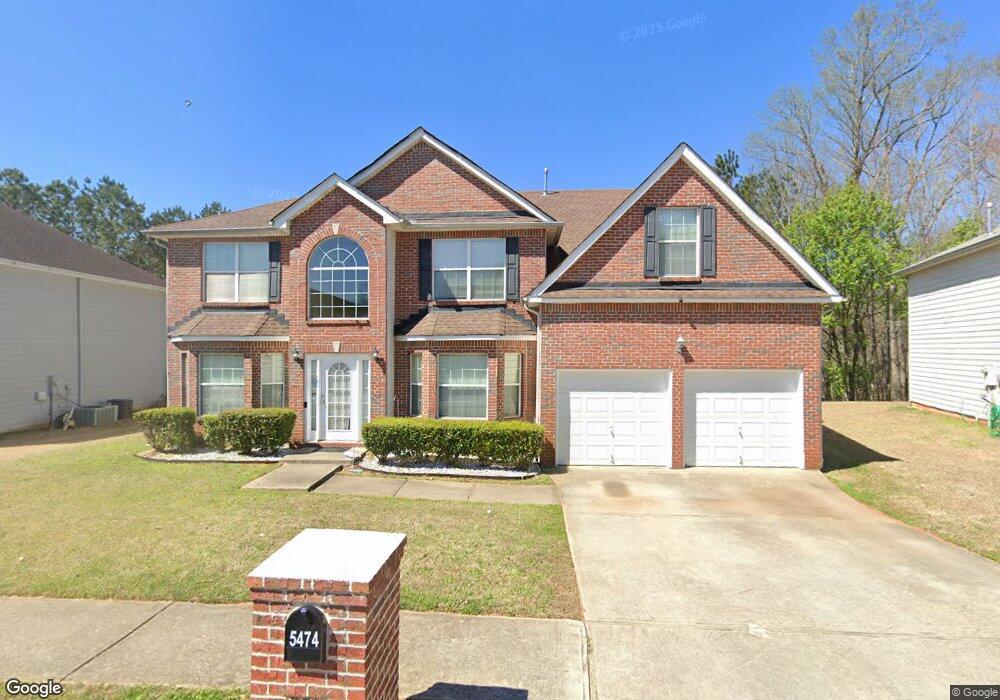
5474 Platte Dr Ellenwood, GA 30294
Estimated Value: $325,809 - $361,000
4
Beds
3
Baths
3,394
Sq Ft
$102/Sq Ft
Est. Value
About This Home
This home is located at 5474 Platte Dr, Ellenwood, GA 30294 and is currently estimated at $347,202, approximately $102 per square foot. 5474 Platte Dr is a home located in Clayton County with nearby schools including East Clayton Elementary School, Adamson Middle School, and Morrow High School.
Ownership History
Date
Name
Owned For
Owner Type
Purchase Details
Closed on
Jan 25, 2012
Sold by
Federal National Mortgage Association
Bought by
Jones Marlita
Current Estimated Value
Home Financials for this Owner
Home Financials are based on the most recent Mortgage that was taken out on this home.
Original Mortgage
$121,831
Outstanding Balance
$85,362
Interest Rate
4.37%
Mortgage Type
FHA
Estimated Equity
$261,840
Purchase Details
Closed on
Oct 6, 2009
Sold by
Suntrust Mtg Inc
Bought by
Federal Natl Mtg Assn Fnma
Purchase Details
Closed on
Oct 27, 2006
Sold by
Legacy Communities Stagecoach
Bought by
Nkrumah Shadrack
Home Financials for this Owner
Home Financials are based on the most recent Mortgage that was taken out on this home.
Original Mortgage
$174,350
Interest Rate
6.31%
Mortgage Type
New Conventional
Create a Home Valuation Report for This Property
The Home Valuation Report is an in-depth analysis detailing your home's value as well as a comparison with similar homes in the area
Home Values in the Area
Average Home Value in this Area
Purchase History
| Date | Buyer | Sale Price | Title Company |
|---|---|---|---|
| Jones Marlita | $125,000 | -- | |
| Federal Natl Mtg Assn Fnma | -- | -- | |
| Suntrust Mtg Inc | $185,316 | -- | |
| Nkrumah Shadrack | $218,000 | -- |
Source: Public Records
Mortgage History
| Date | Status | Borrower | Loan Amount |
|---|---|---|---|
| Open | Jones Marlita | $121,831 | |
| Previous Owner | Nkrumah Shadrack | $174,350 |
Source: Public Records
Tax History Compared to Growth
Tax History
| Year | Tax Paid | Tax Assessment Tax Assessment Total Assessment is a certain percentage of the fair market value that is determined by local assessors to be the total taxable value of land and additions on the property. | Land | Improvement |
|---|---|---|---|---|
| 2024 | $4,618 | $127,400 | $10,400 | $117,000 |
| 2023 | $4,977 | $137,840 | $10,400 | $127,440 |
| 2022 | $3,743 | $104,400 | $10,400 | $94,000 |
| 2021 | $3,155 | $88,920 | $10,400 | $78,520 |
| 2020 | $2,812 | $79,354 | $10,400 | $68,954 |
| 2019 | $2,779 | $77,516 | $9,600 | $67,916 |
| 2018 | $2,777 | $77,474 | $9,600 | $67,874 |
| 2017 | $2,382 | $67,609 | $9,600 | $58,009 |
| 2016 | $2,112 | $60,980 | $9,600 | $51,380 |
| 2015 | $2,099 | $0 | $0 | $0 |
| 2014 | $1,660 | $50,758 | $9,600 | $41,158 |
Source: Public Records
Map
Nearby Homes
- 5514 Frontier Ct
- 5550 Frontier Ct Unit 2
- The Brookwood Plan at Legacy at Stagecoach
- The Northview Plan at Legacy at Stagecoach
- The Thorton Plan at Legacy at Stagecoach
- The Lancaster Plan at Legacy at Stagecoach
- The Chadwick Plan at Legacy at Stagecoach
- The Yorkshire Plan at Legacy at Stagecoach
- The Donovan Plan at Legacy at Stagecoach
- The Cheshire Plan at Legacy at Stagecoach
- 3614 Stagecoach Pass
- 5810 Mistyview Dr Unit 3
- 3821 Rex Mill Square
- 5861 Colonnade Dr
- 5781 Creekside Dr
- 3874 Rex Cir
- 3694 Rex Rd
- 3548 Meadowview Ct
- 5847 Pinetree Ln
- 5210 Katherine Village Dr
- 5478 Platte Dr
- 5470 Platte Dr
- 5482 Platte Dr
- 5462 Platte Dr
- 5473 Platte Dr
- 3682 Fremont Dr
- 5592 Washakie Point
- 5481 Platte Dr
- 5486 Platte Dr
- 5458 Platte Dr
- 5596 Washakie Point
- 5556 Shoshone Pass
- 5562 Shoshone Pass
- 5485 Platte Dr
- 5490 Platte Dr
- 3683 Fremont Dr
- 3700 Fremont Dr
- 5454 Platte Dr
- 5600 Washakie Point
- 5483 Platte Dr