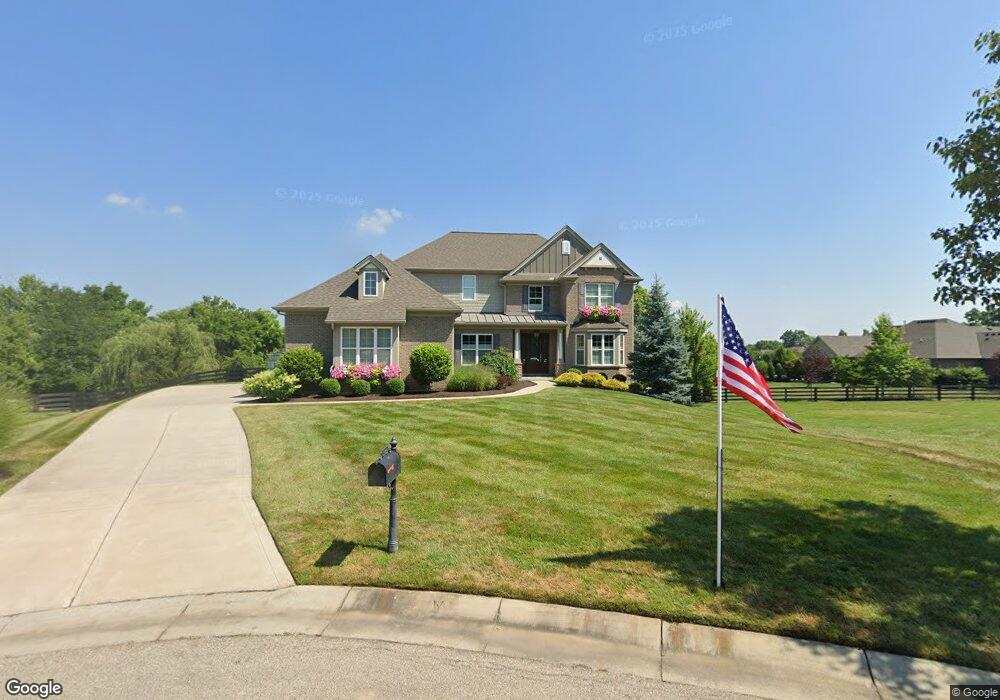
5484 Walkers Ct Liberty Twp., OH 45011
Estimated Value: $884,000 - $1,237,000
4
Beds
5
Baths
3,445
Sq Ft
$297/Sq Ft
Est. Value
About This Home
This home is located at 5484 Walkers Ct, Liberty Twp., OH 45011 and is currently estimated at $1,024,231, approximately $297 per square foot. 5484 Walkers Ct is a home with nearby schools including Cherokee Elementary School, Heritage Early Childhood School, and Lakota Plains Junior School.
Ownership History
Date
Name
Owned For
Owner Type
Purchase Details
Closed on
Aug 7, 2015
Sold by
Jack H Weiland Builders Inc
Bought by
Enger Nicholas W and Enger Kristin L
Current Estimated Value
Home Financials for this Owner
Home Financials are based on the most recent Mortgage that was taken out on this home.
Original Mortgage
$86,440
Outstanding Balance
$67,565
Interest Rate
4.01%
Mortgage Type
New Conventional
Estimated Equity
$956,666
Purchase Details
Closed on
Dec 17, 2014
Sold by
M I Homes Of Cincinnati Llc
Bought by
Jack H Wieland Builders Inc
Home Financials for this Owner
Home Financials are based on the most recent Mortgage that was taken out on this home.
Original Mortgage
$428,500
Interest Rate
3.97%
Mortgage Type
Commercial
Purchase Details
Closed on
Oct 31, 2013
Sold by
Liberty Land Company Llc
Bought by
M I Homes Of Cincinnati Llc
Create a Home Valuation Report for This Property
The Home Valuation Report is an in-depth analysis detailing your home's value as well as a comparison with similar homes in the area
Home Values in the Area
Average Home Value in this Area
Purchase History
| Date | Buyer | Sale Price | Title Company |
|---|---|---|---|
| Enger Nicholas W | $559,640 | Attorney | |
| Jack H Wieland Builders Inc | $122,000 | None Available | |
| M I Homes Of Cincinnati Llc | $439,500 | First Title Agency Inc |
Source: Public Records
Mortgage History
| Date | Status | Borrower | Loan Amount |
|---|---|---|---|
| Open | Enger Nicholas W | $86,440 | |
| Previous Owner | Jack H Wieland Builders Inc | $428,500 |
Source: Public Records
Tax History Compared to Growth
Tax History
| Year | Tax Paid | Tax Assessment Tax Assessment Total Assessment is a certain percentage of the fair market value that is determined by local assessors to be the total taxable value of land and additions on the property. | Land | Improvement |
|---|---|---|---|---|
| 2024 | $11,080 | $276,910 | $61,210 | $215,700 |
| 2023 | $10,941 | $276,910 | $61,210 | $215,700 |
| 2022 | $10,795 | $213,600 | $61,210 | $152,390 |
| 2021 | $9,626 | $191,850 | $61,210 | $130,640 |
| 2020 | $9,876 | $191,850 | $61,210 | $130,640 |
| 2019 | $11,997 | $124,540 | $57,060 | $67,480 |
| 2018 | $10,776 | $192,020 | $57,060 | $134,960 |
| 2017 | $10,933 | $192,020 | $57,060 | $134,960 |
| 2016 | $9,984 | $173,570 | $57,060 | $116,510 |
| 2015 | $2,088 | $35,420 | $35,420 | $0 |
| 2014 | -- | $35,420 | $35,420 | $0 |
Source: Public Records
Map
Nearby Homes
- 6290 Winding Creek Blvd
- 6351 Lesourdsville West Chester Rd
- 6189 Lesourdsville West Chester Rd
- 6140 Winding Creek Blvd
- 5934 Trotters Way
- 5850 Millikin Rd
- 5053 Maiden Way
- 5038 Maiden Way
- 6075 Northlake Ct
- 7077 Parliament Place
- 5011 Arena Ct
- Sanibel Plan at Carriage Meadows
- Carlisle Plan at Carriage Meadows
- Chattanooga Plan at Carriage Meadows
- Rockford Plan at Carriage Meadows
- Miramar Plan at Carriage Meadows
- Somerset Plan at Carriage Meadows
- Truman Plan at Carriage Meadows
- Harding Plan at Carriage Meadows
- Eisenhower Plan at Carriage Meadows
- 5474 Walkers Ct
- 6216 Coach House Way
- 6259 Winding Creek Blvd
- 5477 Walkers Ct
- 6246 Coach House Way
- 5487 Walkers Ct
- 6279 Winding Creek Blvd
- 6276 Coach House Way
- 5494 Walkers Ct
- 6266 Coach House Way
- 6329 Winding Creek Blvd
- 6339 Winding Creek Blvd
- 85 Coach House Way
- 88 Coach House Way
- 93 Coach House Way
- 6296 Coach House Way
- 6205 Coach House Way
- 6349 Winding Creek Blvd
- 6265 Coach House Way
- 6255 Coach House Way