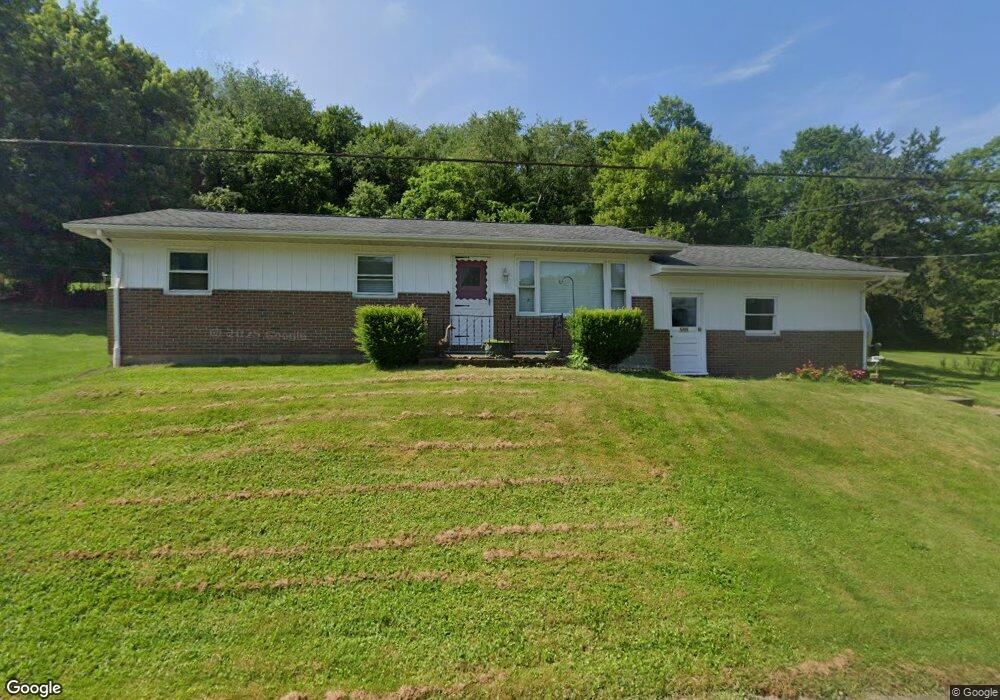
5488 Depot St SE New Philadelphia, OH 44663
Estimated Value: $81,000 - $141,035
3
Beds
2
Baths
960
Sq Ft
$123/Sq Ft
Est. Value
About This Home
This home is located at 5488 Depot St SE, New Philadelphia, OH 44663 and is currently estimated at $118,259, approximately $123 per square foot. 5488 Depot St SE is a home located in Tuscarawas County with nearby schools including Midvale Elementary School, Tuscarawas Middle School, and Indian Valley High School.
Ownership History
Date
Name
Owned For
Owner Type
Purchase Details
Closed on
Nov 27, 2017
Sold by
Arnold Andrea J
Bought by
Arnold Andrea J
Current Estimated Value
Home Financials for this Owner
Home Financials are based on the most recent Mortgage that was taken out on this home.
Original Mortgage
$48,000
Outstanding Balance
$37,659
Interest Rate
3.88%
Mortgage Type
New Conventional
Estimated Equity
$80,600
Purchase Details
Closed on
Sep 4, 2013
Sold by
Contini Jeffrey L
Bought by
Arnold Andrea J
Home Financials for this Owner
Home Financials are based on the most recent Mortgage that was taken out on this home.
Original Mortgage
$27,550
Interest Rate
4.29%
Mortgage Type
Future Advance Clause Open End Mortgage
Purchase Details
Closed on
Aug 10, 1992
Sold by
Martinelli Lena M and Martinelli Camillo
Bought by
Martinelli Camillo
Purchase Details
Closed on
Apr 18, 1988
Sold by
Martinelli Lena M
Bought by
Arnold Andrea J and Martinelli Camillo
Create a Home Valuation Report for This Property
The Home Valuation Report is an in-depth analysis detailing your home's value as well as a comparison with similar homes in the area
Home Values in the Area
Average Home Value in this Area
Purchase History
| Date | Buyer | Sale Price | Title Company |
|---|---|---|---|
| Arnold Andrea J | -- | None Available | |
| Arnold Andrea J | $29,000 | None Available | |
| Martinelli Camillo | -- | -- | |
| Arnold Andrea J | -- | -- |
Source: Public Records
Mortgage History
| Date | Status | Borrower | Loan Amount |
|---|---|---|---|
| Open | Arnold Andrea J | $48,000 | |
| Closed | Arnold Andrea J | $27,550 |
Source: Public Records
Tax History Compared to Growth
Tax History
| Year | Tax Paid | Tax Assessment Tax Assessment Total Assessment is a certain percentage of the fair market value that is determined by local assessors to be the total taxable value of land and additions on the property. | Land | Improvement |
|---|---|---|---|---|
| 2024 | $686 | $17,290 | $4,800 | $12,490 |
| 2023 | $1,170 | $49,390 | $13,710 | $35,680 |
| 2022 | $694 | $17,287 | $4,799 | $12,488 |
| 2021 | $668 | $15,127 | $3,409 | $11,718 |
| 2020 | $661 | $15,127 | $3,409 | $11,718 |
| 2019 | $662 | $15,127 | $3,409 | $11,718 |
| 2018 | $601 | $12,870 | $2,980 | $9,890 |
| 2017 | $606 | $12,870 | $2,980 | $9,890 |
| 2016 | $601 | $12,870 | $2,980 | $9,890 |
| 2014 | $561 | $11,500 | $2,360 | $9,140 |
| 2013 | $328 | $19,740 | $2,360 | $17,380 |
Source: Public Records
Map
Nearby Homes
- 6006 Echo Lake Rd NE
- 1734 Barnhill Rd
- 6285 Adams Rd NE
- 1728 Tall Timber Rd NE
- 2006 Buckeye St NE
- 4711 Broadway
- 0 Royal St
- 0 Vernon St Unit 5009296
- 2709 Backwater Rd SE
- 2923 Brightwood Rd SE
- 2993 Brightwood Rd SE
- 1223 New Cumberland Rd NE
- 2363 Tabor Ridge Rd NE
- 247 Kent Cir NE
- 1224 Pine Bluff Dr NE
- 0 Cutler Rd NE Unit 5156445
- 0 Cutler Rd NE Unit 5156452
- 0 Cutler Rd NE Unit 5156457
- 2025 N Water Street Extension
- 1577 State Route 39 NE
- 5506 Depot St SE
- 5454 Depot St SE
- 5520 Depot Street Extension SE
- 5546 Depot St SE
- 5434 Depot St SE
- 259 Barnhill Rd SE
- 5922 Depot Street Extension SE
- 252 Barnhill Rd SE
- 207 Barnhill Rd NE
- 274 Barnhill Rd SE
- 102 Barnhill Rd SE
- 206 Barnhill Rd NE
- 5458 Main St SE
- 5468 Main St SE
- 600 Marshall Turrin Dr SE
- 5430 Main St SE
- 5420 Main St SE
- 161 Barnhill Rd NE
- 170 Barnhill Rd NE
- 5968 Depot Street Extension SE