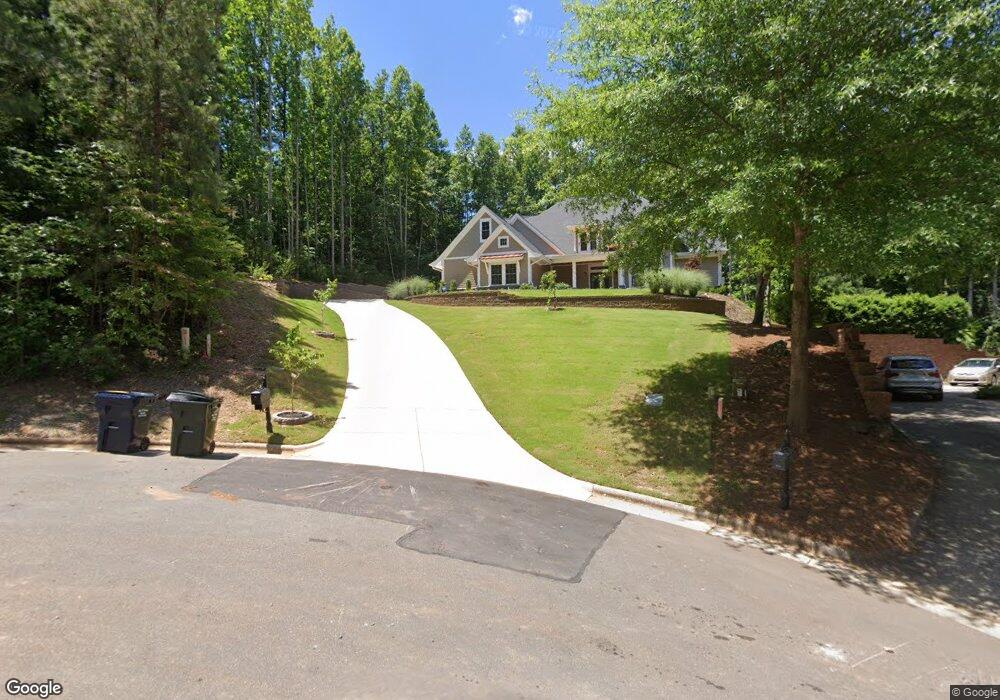
55 Barn Owl Ln Pittsboro, NC 27312
Estimated Value: $691,000 - $833,000
4
Beds
5
Baths
2,503
Sq Ft
$303/Sq Ft
Est. Value
About This Home
This home is located at 55 Barn Owl Ln, Pittsboro, NC 27312 and is currently estimated at $757,583, approximately $302 per square foot. 55 Barn Owl Ln is a home located in Chatham County with nearby schools including Pittsboro Elementary School, George Moses Horton Middle School, and Northwood High.
Ownership History
Date
Name
Owned For
Owner Type
Purchase Details
Closed on
Apr 11, 2024
Sold by
Racf Llc
Bought by
Weissman Justin Scott and Weissman Maria Jose
Current Estimated Value
Home Financials for this Owner
Home Financials are based on the most recent Mortgage that was taken out on this home.
Original Mortgage
$602,600
Outstanding Balance
$593,698
Interest Rate
6.94%
Mortgage Type
FHA
Estimated Equity
$163,885
Purchase Details
Closed on
Dec 19, 2023
Sold by
Poleon Lilieth and Poleon John
Bought by
Racf Llc
Home Financials for this Owner
Home Financials are based on the most recent Mortgage that was taken out on this home.
Original Mortgage
$450,000
Interest Rate
7.5%
Mortgage Type
New Conventional
Purchase Details
Closed on
Feb 16, 2021
Sold by
Thornton Curtis W and Thornton Vesna
Bought by
Occenad Lilieth I
Purchase Details
Closed on
Dec 9, 2010
Sold by
Wells Fargo Bank N A
Bought by
Thornton Curtis W and Thornton Vesna
Create a Home Valuation Report for This Property
The Home Valuation Report is an in-depth analysis detailing your home's value as well as a comparison with similar homes in the area
Home Values in the Area
Average Home Value in this Area
Purchase History
| Date | Buyer | Sale Price | Title Company |
|---|---|---|---|
| Weissman Justin Scott | $625,000 | None Listed On Document | |
| Racf Llc | $500,000 | None Listed On Document | |
| Occenad Lilieth I | $38,000 | None Available | |
| Thornton Curtis W | $20,000 | None Available |
Source: Public Records
Mortgage History
| Date | Status | Borrower | Loan Amount |
|---|---|---|---|
| Open | Weissman Justin Scott | $602,600 | |
| Previous Owner | Racf Llc | $450,000 |
Source: Public Records
Tax History Compared to Growth
Tax History
| Year | Tax Paid | Tax Assessment Tax Assessment Total Assessment is a certain percentage of the fair market value that is determined by local assessors to be the total taxable value of land and additions on the property. | Land | Improvement |
|---|---|---|---|---|
| 2025 | $6,153 | $709,223 | $94,440 | $614,783 |
| 2024 | $3,922 | $452,101 | $52,729 | $399,372 |
| 2023 | $4,059 | $227,171 | $47,456 | $179,715 |
| 2022 | $697 | $88,056 | $47,456 | $40,600 |
| 2021 | $0 | $47,456 | $47,456 | $0 |
| 2020 | $270 | $34,020 | $34,020 | $0 |
| 2019 | $270 | $34,020 | $34,020 | $0 |
| 2018 | $255 | $34,020 | $34,020 | $0 |
| 2017 | $255 | $34,020 | $34,020 | $0 |
| 2016 | $613 | $81,000 | $81,000 | $0 |
| 2015 | $603 | $81,000 | $81,000 | $0 |
| 2014 | $598 | $81,000 | $81,000 | $0 |
| 2013 | -- | $81,000 | $81,000 | $0 |
Source: Public Records
Map
Nearby Homes
- 64 Barn Owl Ln
- 59 Mist Wood Ct
- 7 Brandon Pines Ct
- 15 Brandon Pines Ct
- 56 Mist Wood Ct
- 112 Golfers View
- 8 Pin Tail Ct
- 48 Sweet Meadow Ln
- 44 Sweet Meadow Ln
- 249 High Ridge Ln
- 37 Golfers View
- 139 Quail Point
- 62 Teal Trace Ct
- 45 Quail Point
- 21 Bob White Way
- 103 Brandy Mill
- 149 Brandy Mill
- 316 Chapel Ridge Dr
- 121 Chapel Ridge Dr
- 829 Chapel Ridge Dr
- 55 Barn Owl Ln Unit 166
- 55 Barn Owl Ln Unit 166
- 55 Barn Owl Ln
- 63 Barn Owl Ln
- 45 Barn Owl Ln
- 27 Downey Bluff
- lot 174 Barn Owl
- 64 Barn Owl Ln Unit Lot 168
- 56 Barn Owl Ln Unit 169
- 56 Barn Owl Ln
- 52 Barn Owl Ln Unit 170
- 44 Barn Owl Ln Unit 171
- 11 Downey Bluff
- 0 Downey Bluff Unit 1750062
- 0 Downey Bluff Unit 176 TR1750062
- 28 Downey Bluff Unit 175
- 28 Downey Bluff
- 15 Barn Owl Ln
- 38 Barn Owl Ln
- 38 Barn Owl Ln