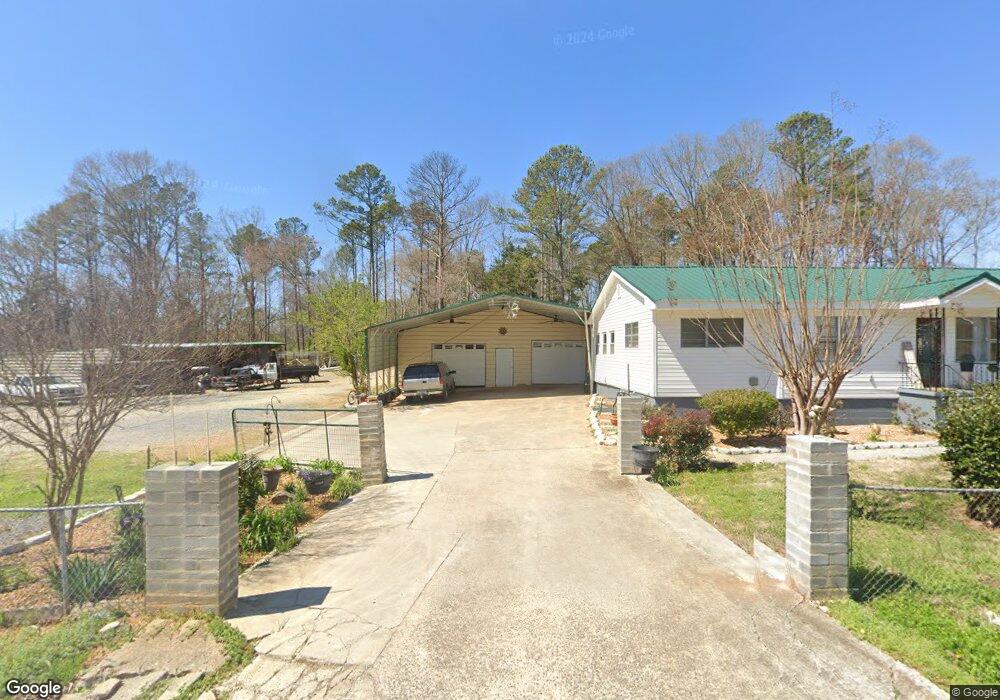
55 Franklin St Cedartown, GA 30125
Estimated Value: $152,000 - $231,000
3
Beds
2
Baths
1,488
Sq Ft
$128/Sq Ft
Est. Value
About This Home
This home is located at 55 Franklin St, Cedartown, GA 30125 and is currently estimated at $190,402, approximately $127 per square foot. 55 Franklin St is a home located in Polk County with nearby schools including Cedar Christian School.
Ownership History
Date
Name
Owned For
Owner Type
Purchase Details
Closed on
Mar 20, 2019
Sold by
Cheatwood Marvin
Bought by
Velasquez Carlos Perez and Velasquez Alejandrina Perez
Current Estimated Value
Home Financials for this Owner
Home Financials are based on the most recent Mortgage that was taken out on this home.
Original Mortgage
$48,331
Outstanding Balance
$8,419
Interest Rate
4.3%
Mortgage Type
New Conventional
Estimated Equity
$181,983
Purchase Details
Closed on
Jul 1, 2002
Sold by
Brown Nancy C
Bought by
Cheatwood Marvin and Angie Robinson
Purchase Details
Closed on
May 31, 1996
Sold by
Annie Cook J and Annie Dell
Bought by
Brown Nancy C
Purchase Details
Closed on
Aug 22, 1952
Bought by
Cook J W
Create a Home Valuation Report for This Property
The Home Valuation Report is an in-depth analysis detailing your home's value as well as a comparison with similar homes in the area
Home Values in the Area
Average Home Value in this Area
Purchase History
| Date | Buyer | Sale Price | Title Company |
|---|---|---|---|
| Velasquez Carlos Perez | $48,331 | -- | |
| Cheatwood Marvin | $62,000 | -- | |
| Brown Nancy C | -- | -- | |
| Cook J W | -- | -- |
Source: Public Records
Mortgage History
| Date | Status | Borrower | Loan Amount |
|---|---|---|---|
| Open | Velasquez Carlos Perez | $48,331 |
Source: Public Records
Tax History Compared to Growth
Tax History
| Year | Tax Paid | Tax Assessment Tax Assessment Total Assessment is a certain percentage of the fair market value that is determined by local assessors to be the total taxable value of land and additions on the property. | Land | Improvement |
|---|---|---|---|---|
| 2024 | $994 | $47,572 | $2,200 | $45,372 |
| 2023 | $878 | $36,980 | $3,322 | $33,658 |
| 2022 | $758 | $31,942 | $2,948 | $28,994 |
| 2021 | $768 | $31,942 | $2,948 | $28,994 |
| 2020 | $769 | $31,942 | $2,948 | $28,994 |
| 2019 | $624 | $23,245 | $2,851 | $20,394 |
| 2018 | $611 | $22,164 | $2,443 | $19,721 |
| 2017 | $603 | $22,164 | $2,443 | $19,721 |
| 2016 | $603 | $22,164 | $2,443 | $19,721 |
| 2015 | $606 | $22,188 | $2,443 | $19,744 |
| 2014 | $621 | $22,595 | $2,851 | $19,744 |
Source: Public Records
Map
Nearby Homes