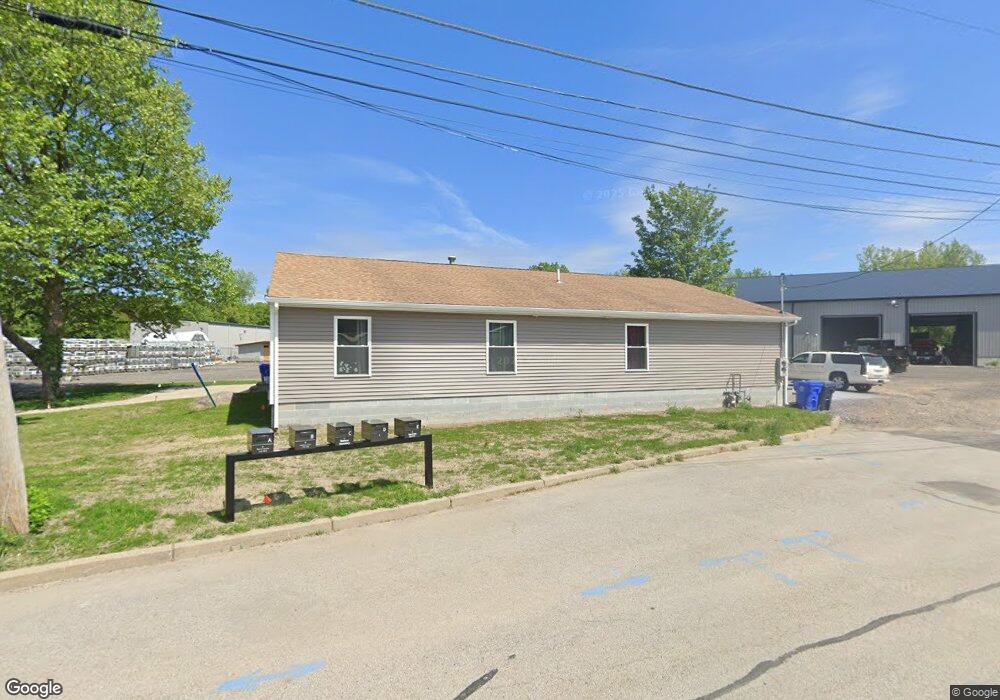
55 Industrial Ln West Warwick, RI 02893
Lippitt-Harris NeighborhoodEstimated Value: $645,601
3
Beds
3
Baths
2,300
Sq Ft
$281/Sq Ft
Est. Value
About This Home
This home is located at 55 Industrial Ln, West Warwick, RI 02893 and is currently estimated at $645,601, approximately $280 per square foot. 55 Industrial Ln is a home located in Kent County with nearby schools including West Warwick High School, St Joseph School, and Islamic School of Rhode Island.
Ownership History
Date
Name
Owned For
Owner Type
Purchase Details
Closed on
Sep 22, 2023
Sold by
Franmer Pro Of Ri Llc
Bought by
Ramos Masonary Llc
Current Estimated Value
Purchase Details
Closed on
Feb 21, 2017
Sold by
Franmar Properties Of
Bought by
Franmar Properties Of
Purchase Details
Closed on
Jul 5, 2016
Sold by
4 N Properties Llc
Bought by
Franmer Properties Of
Home Financials for this Owner
Home Financials are based on the most recent Mortgage that was taken out on this home.
Original Mortgage
$121,500
Interest Rate
3.58%
Mortgage Type
New Conventional
Purchase Details
Closed on
Jun 29, 2016
Sold by
4 N Properties Llc
Bought by
Nunes Roderick T and Nunes Diane M
Home Financials for this Owner
Home Financials are based on the most recent Mortgage that was taken out on this home.
Original Mortgage
$121,500
Interest Rate
3.58%
Mortgage Type
New Conventional
Purchase Details
Closed on
Apr 28, 2016
Sold by
Guthrie Joseph and Guthrie Deborah
Bought by
4N Properties Llc
Purchase Details
Closed on
Nov 17, 2004
Sold by
Clarence J Contu T J and Clarence Coutu
Bought by
4 N Properties Llc
Home Financials for this Owner
Home Financials are based on the most recent Mortgage that was taken out on this home.
Original Mortgage
$700,000
Interest Rate
5.8%
Mortgage Type
Purchase Money Mortgage
Create a Home Valuation Report for This Property
The Home Valuation Report is an in-depth analysis detailing your home's value as well as a comparison with similar homes in the area
Home Values in the Area
Average Home Value in this Area
Purchase History
| Date | Buyer | Sale Price | Title Company |
|---|---|---|---|
| Ramos Masonary Llc | $539,000 | None Available | |
| Ramos Masonary Llc | $539,000 | None Available | |
| Franmar Properties Of | -- | -- | |
| Franmar Properties Of | -- | -- | |
| Franmer Properties Of | -- | -- | |
| Franmer Properties Of | -- | -- | |
| Nunes Roderick T | $225,000 | -- | |
| Nunes Roderick T | $225,000 | -- | |
| 4N Properties Llc | $125,000 | -- | |
| 4N Properties Llc | $125,000 | -- | |
| 4 N Properties Llc | $800,000 | -- | |
| 4 N Properties Llc | $800,000 | -- |
Source: Public Records
Mortgage History
| Date | Status | Borrower | Loan Amount |
|---|---|---|---|
| Previous Owner | Nunes Roderick T | $121,500 | |
| Previous Owner | 4 N Properties Llc | $450,000 | |
| Previous Owner | 4 N Properties Llc | $700,000 |
Source: Public Records
Tax History Compared to Growth
Tax History
| Year | Tax Paid | Tax Assessment Tax Assessment Total Assessment is a certain percentage of the fair market value that is determined by local assessors to be the total taxable value of land and additions on the property. | Land | Improvement |
|---|---|---|---|---|
| 2025 | $13,636 | $954,200 | $209,800 | $744,400 |
| 2024 | $15,558 | $486,200 | $191,200 | $295,000 |
| 2023 | $11,729 | $373,900 | $191,200 | $182,700 |
| 2022 | $11,546 | $373,900 | $191,200 | $182,700 |
| 2021 | $12,781 | $394,100 | $214,500 | $179,600 |
| 2020 | $12,781 | $394,100 | $214,500 | $179,600 |
| 2019 | $12,540 | $394,100 | $214,500 | $179,600 |
| 2018 | $10,478 | $315,800 | $212,500 | $103,300 |
| 2017 | $5,730 | $151,000 | $47,700 | $103,300 |
| 2016 | $5,628 | $151,000 | $47,700 | $103,300 |
| 2015 | $5,781 | $155,100 | $47,700 | $107,400 |
| 2014 | $5,653 | $155,100 | $47,700 | $107,400 |
Source: Public Records
Map
Nearby Homes