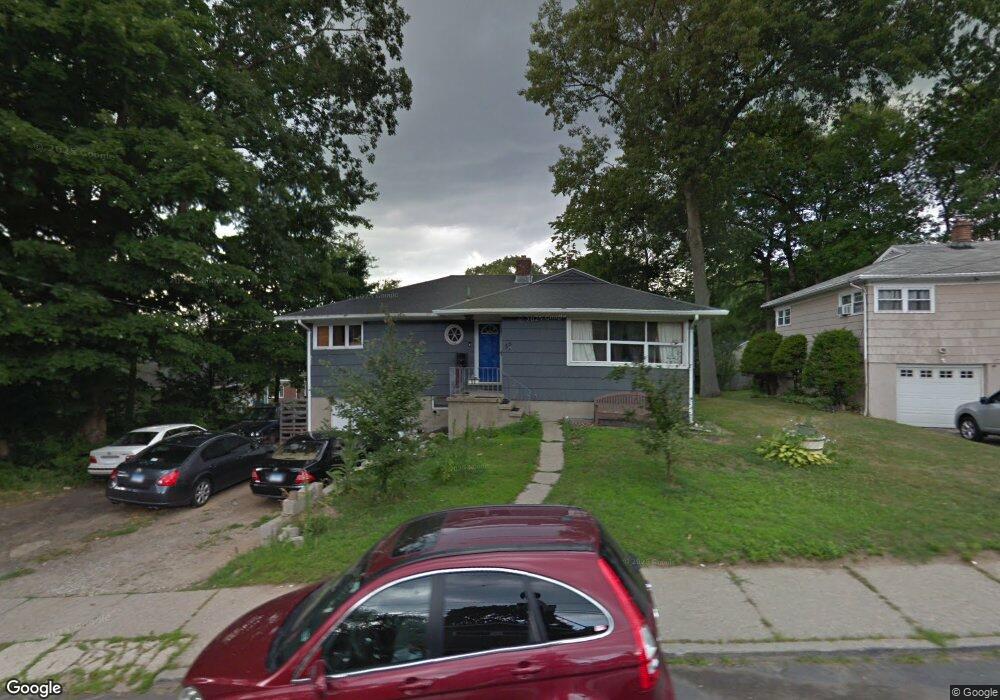
55 Moran St Waterbury, CT 06704
North End District NeighborhoodEstimated Value: $308,000 - $393,000
3
Beds
2
Baths
1,504
Sq Ft
$224/Sq Ft
Est. Value
About This Home
This home is located at 55 Moran St, Waterbury, CT 06704 and is currently estimated at $336,759, approximately $223 per square foot. 55 Moran St is a home located in New Haven County with nearby schools including F. J. Kingsbury School, North End Middle School, and Wilby High School.
Ownership History
Date
Name
Owned For
Owner Type
Purchase Details
Closed on
Aug 27, 2004
Sold by
Blanden William E and Blanden Rose E
Bought by
Reid Hope S
Current Estimated Value
Purchase Details
Closed on
Jul 11, 1995
Sold by
Platt Frances and Platt Fred
Bought by
Blanden William and Blanden Rose
Create a Home Valuation Report for This Property
The Home Valuation Report is an in-depth analysis detailing your home's value as well as a comparison with similar homes in the area
Home Values in the Area
Average Home Value in this Area
Purchase History
| Date | Buyer | Sale Price | Title Company |
|---|---|---|---|
| Reid Hope S | $156,000 | -- | |
| Blanden William | $117,500 | -- |
Source: Public Records
Mortgage History
| Date | Status | Borrower | Loan Amount |
|---|---|---|---|
| Open | Blanden William | $172,480 | |
| Closed | Blanden William | $43,120 | |
| Closed | Blanden William | $27,142 |
Source: Public Records
Tax History Compared to Growth
Tax History
| Year | Tax Paid | Tax Assessment Tax Assessment Total Assessment is a certain percentage of the fair market value that is determined by local assessors to be the total taxable value of land and additions on the property. | Land | Improvement |
|---|---|---|---|---|
| 2025 | $5,737 | $127,540 | $19,810 | $107,730 |
| 2024 | $6,306 | $127,540 | $19,810 | $107,730 |
| 2023 | $6,911 | $127,540 | $19,810 | $107,730 |
| 2022 | $4,487 | $74,520 | $19,840 | $54,680 |
| 2021 | $4,487 | $74,520 | $19,840 | $54,680 |
| 2020 | $4,487 | $74,520 | $19,840 | $54,680 |
| 2019 | $4,487 | $74,520 | $19,840 | $54,680 |
| 2018 | $4,487 | $74,520 | $19,840 | $54,680 |
| 2017 | $4,751 | $78,900 | $19,830 | $59,070 |
| 2016 | $4,751 | $78,900 | $19,830 | $59,070 |
| 2015 | $4,594 | $78,900 | $19,830 | $59,070 |
| 2014 | $4,594 | $78,900 | $19,830 | $59,070 |
Source: Public Records
Map
Nearby Homes
- 58 Moran St
- 19 Collins St
- 651 Cooke St
- 52 Herkimer St
- 74 Macarthur Dr
- 95 Clinton St
- 3 Herkimer St
- 42 Concord St
- 57 Grace Ave
- 96 Dracut Ave
- 19 Lenox St
- 102 Waverly St
- 135 Williamson Dr
- 124 Williamson Dr
- 138 Williamson Dr
- 500 Hill St
- 0 Lonsdale St
- 578 Columbia Boulevard Extension
- 335 Perkins Ave Unit 7
- 231 Hauser St