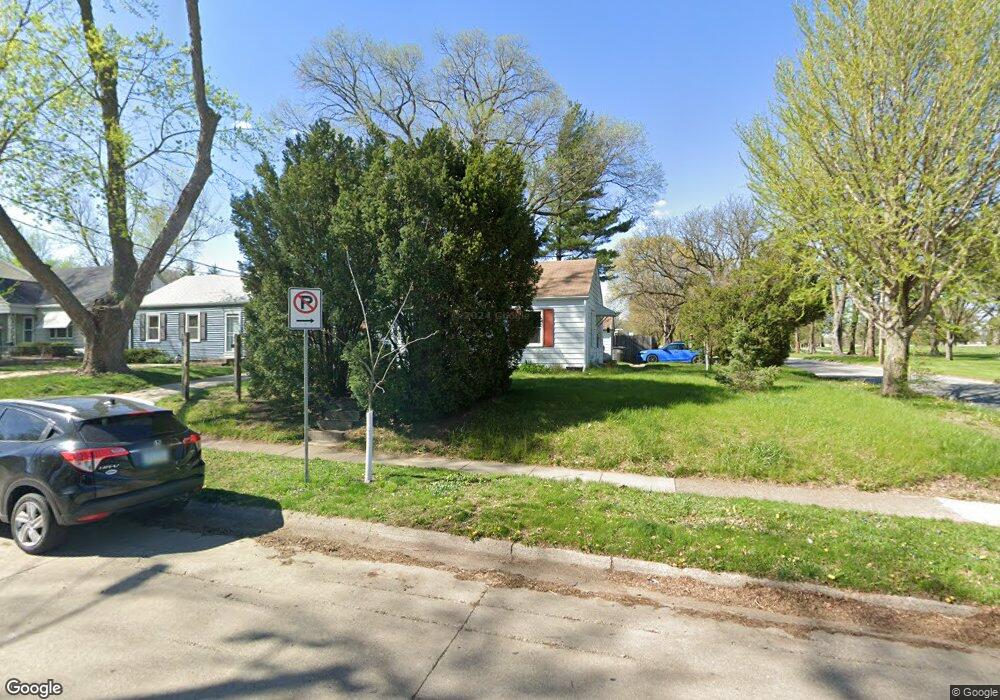
5501 Forest Ave Des Moines, IA 50311
Merle Hay NeighborhoodEstimated Value: $165,659 - $187,000
2
Beds
1
Bath
616
Sq Ft
$289/Sq Ft
Est. Value
About This Home
This home is located at 5501 Forest Ave, Des Moines, IA 50311 and is currently estimated at $177,915, approximately $288 per square foot. 5501 Forest Ave is a home located in Polk County with nearby schools including Windsor Elementary School, Merrill Middle School, and Roosevelt High School.
Ownership History
Date
Name
Owned For
Owner Type
Purchase Details
Closed on
Mar 15, 2001
Sold by
Ghiasi David A R and Gregg Jo Ann
Bought by
Ghiasi Enterprises Llc
Current Estimated Value
Purchase Details
Closed on
Mar 15, 1999
Sold by
Estate Of Merritt D Deutsche and Deutsche Mary L
Bought by
Ghiasi David
Home Financials for this Owner
Home Financials are based on the most recent Mortgage that was taken out on this home.
Original Mortgage
$36,800
Interest Rate
6.41%
Mortgage Type
Balloon
Create a Home Valuation Report for This Property
The Home Valuation Report is an in-depth analysis detailing your home's value as well as a comparison with similar homes in the area
Home Values in the Area
Average Home Value in this Area
Purchase History
| Date | Buyer | Sale Price | Title Company |
|---|---|---|---|
| Ghiasi Enterprises Llc | -- | -- | |
| Ghiasi David | $45,500 | -- |
Source: Public Records
Mortgage History
| Date | Status | Borrower | Loan Amount |
|---|---|---|---|
| Previous Owner | Ghiasi David | $36,800 |
Source: Public Records
Tax History Compared to Growth
Tax History
| Year | Tax Paid | Tax Assessment Tax Assessment Total Assessment is a certain percentage of the fair market value that is determined by local assessors to be the total taxable value of land and additions on the property. | Land | Improvement |
|---|---|---|---|---|
| 2025 | $2,384 | $148,200 | $49,600 | $98,600 |
| 2024 | $2,384 | $131,700 | $43,700 | $88,000 |
| 2023 | $2,544 | $131,700 | $43,700 | $88,000 |
| 2022 | $2,522 | $116,800 | $39,500 | $77,300 |
| 2021 | $2,398 | $116,800 | $39,500 | $77,300 |
| 2020 | $2,486 | $104,700 | $35,100 | $69,600 |
| 2019 | $2,278 | $104,700 | $35,100 | $69,600 |
| 2018 | $2,250 | $93,300 | $30,700 | $62,600 |
| 2017 | $1,988 | $93,300 | $30,700 | $62,600 |
| 2016 | $1,932 | $82,000 | $26,800 | $55,200 |
| 2015 | $1,932 | $82,000 | $26,800 | $55,200 |
| 2014 | $1,866 | $78,900 | $25,300 | $53,600 |
Source: Public Records
Map
Nearby Homes