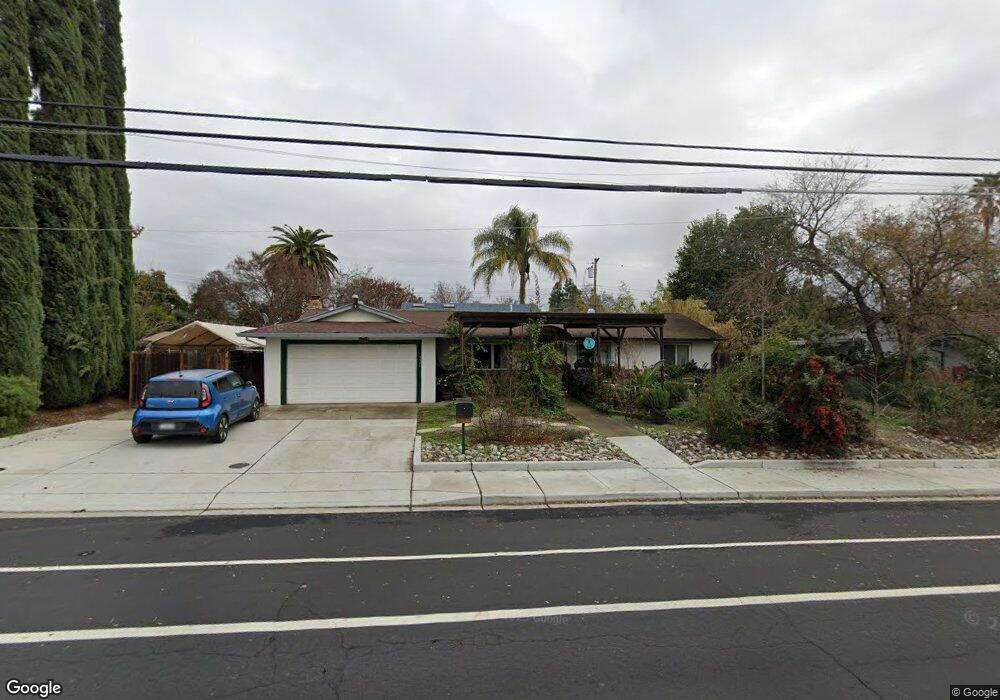
5520 Mariposa Ave Citrus Heights, CA 95610
Estimated Value: $450,000 - $528,000
3
Beds
2
Baths
1,322
Sq Ft
$365/Sq Ft
Est. Value
About This Home
This home is located at 5520 Mariposa Ave, Citrus Heights, CA 95610 and is currently estimated at $482,805, approximately $365 per square foot. 5520 Mariposa Ave is a home located in Sacramento County with nearby schools including Skycrest Elementary School, Will Rogers Middle School, and San Juan High School.
Ownership History
Date
Name
Owned For
Owner Type
Purchase Details
Closed on
Aug 22, 2012
Sold by
Chase Scott and Chase Maureen
Bought by
Chase Scott M and Chase Maureen A
Current Estimated Value
Home Financials for this Owner
Home Financials are based on the most recent Mortgage that was taken out on this home.
Original Mortgage
$226,900
Outstanding Balance
$156,147
Interest Rate
3.53%
Mortgage Type
New Conventional
Estimated Equity
$326,658
Purchase Details
Closed on
Feb 15, 2003
Sold by
Smith Lorie
Bought by
Chase Scott and Chase Maureen
Home Financials for this Owner
Home Financials are based on the most recent Mortgage that was taken out on this home.
Original Mortgage
$212,005
Interest Rate
5.89%
Mortgage Type
FHA
Purchase Details
Closed on
Nov 14, 2002
Sold by
Duvall Duane C and Duvall Sandy M
Bought by
Smith Lorie
Create a Home Valuation Report for This Property
The Home Valuation Report is an in-depth analysis detailing your home's value as well as a comparison with similar homes in the area
Home Values in the Area
Average Home Value in this Area
Purchase History
| Date | Buyer | Sale Price | Title Company |
|---|---|---|---|
| Chase Scott M | -- | Old Republic Title Company | |
| Chase Scott | $215,000 | Financial Title Company | |
| Smith Lorie | $179,000 | -- |
Source: Public Records
Mortgage History
| Date | Status | Borrower | Loan Amount |
|---|---|---|---|
| Open | Chase Scott M | $226,900 | |
| Closed | Chase Scott | $212,005 |
Source: Public Records
Tax History Compared to Growth
Tax History
| Year | Tax Paid | Tax Assessment Tax Assessment Total Assessment is a certain percentage of the fair market value that is determined by local assessors to be the total taxable value of land and additions on the property. | Land | Improvement |
|---|---|---|---|---|
| 2025 | $3,606 | $311,366 | $72,401 | $238,965 |
| 2024 | $3,606 | $305,262 | $70,982 | $234,280 |
| 2023 | $3,513 | $299,278 | $69,591 | $229,687 |
| 2022 | $3,494 | $293,411 | $68,227 | $225,184 |
| 2021 | $3,419 | $287,659 | $66,890 | $220,769 |
| 2020 | $3,354 | $284,711 | $66,205 | $218,506 |
| 2019 | $3,285 | $279,129 | $64,907 | $214,222 |
| 2018 | $3,246 | $273,657 | $63,635 | $210,022 |
| 2017 | $3,213 | $268,292 | $62,388 | $205,904 |
| 2016 | $2,999 | $263,032 | $61,165 | $201,867 |
| 2015 | $2,947 | $259,082 | $60,247 | $198,835 |
| 2014 | $2,792 | $246,136 | $57,236 | $188,900 |
Source: Public Records
Map
Nearby Homes
- 5617 Mariposa Ave
- 7746 Eastgate Ave
- 5424 Mariposa Ave
- 7738 Eastgate Ave
- 7632 Capricorn Dr
- 7449 Willowcreek Dr
- 5718 Southgrove Dr
- 7711 Juan Way Unit 22B
- 5664 San Juan Ave
- 5513 San Juan Ave
- 5333 Primrose Dr Unit 43B
- 5333 Primrose Dr
- 5333 Primrose Dr Unit 24A
- 5333 Primrose Dr Unit 40B
- 5333 Primrose Dr
- 5810 Primrose Dr
- 5645 San Juan Ave
- 5632 Albert Ln
- 5136 Romero Way
- 5829 San Juan Ave Unit 5
- 5530 Mariposa Ave
- 5510 Mariposa Ave
- 5517 Celestial Way
- 5509 Celestial Way
- 5521 Celestial Way
- 7601 Pleides Ave
- 5533 Mariposa Ave
- 5501 Celestial Way
- 5556 Mariposa Ave
- 5524 Celestial Way
- 7599 Twin Bridges Ln
- 5516 Celestial Way
- 5500 Celestial Way
- 5520 Celestial Way
- 5600 Mariposa Ave
- 5432 Mariposa Ave
- 7597 Twin Bridges Ln
- 5601 Mariposa Ave
- 5421 Celestial Way
- 5548 Twin Bridges Loop