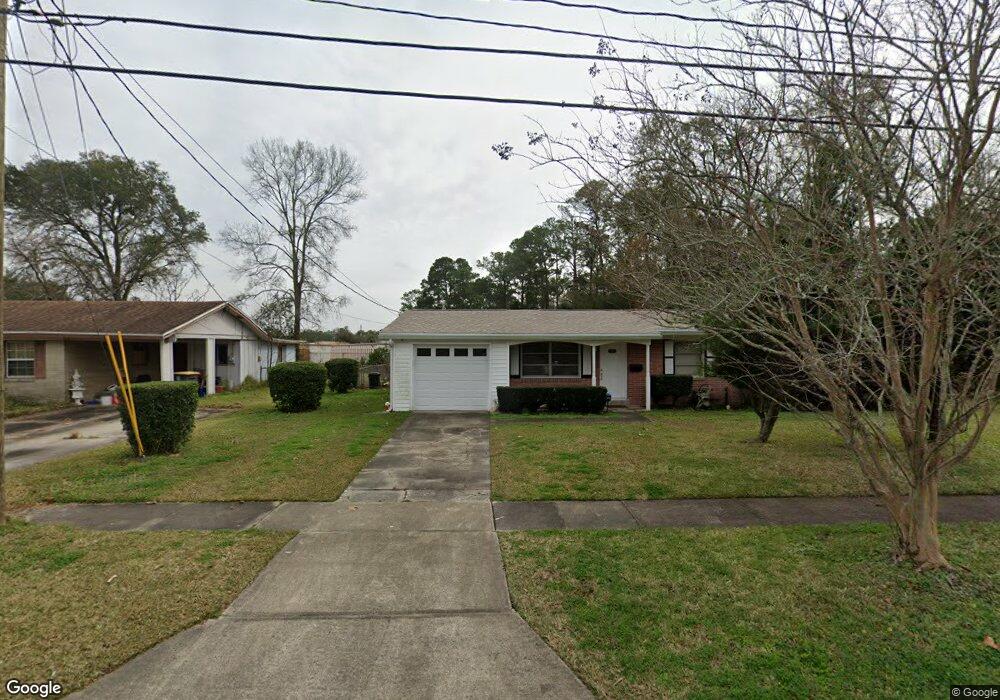
5530 Santa Monica Blvd S Jacksonville, FL 32207
Englewood NeighborhoodEstimated Value: $255,000 - $297,000
3
Beds
2
Baths
1,562
Sq Ft
$172/Sq Ft
Est. Value
About This Home
This home is located at 5530 Santa Monica Blvd S, Jacksonville, FL 32207 and is currently estimated at $269,397, approximately $172 per square foot. 5530 Santa Monica Blvd S is a home located in Duval County with nearby schools including Englewood Elementary School, Southside Middle School, and Englewood High School.
Ownership History
Date
Name
Owned For
Owner Type
Purchase Details
Closed on
Jan 21, 2021
Sold by
Chan Mark D
Bought by
Ming Chan Living Trust
Current Estimated Value
Purchase Details
Closed on
Mar 8, 2006
Sold by
Chan Ming Sam and Chan Ming S
Bought by
Chan Mark D
Purchase Details
Closed on
Aug 13, 2004
Sold by
Chan Bik Yiu
Bought by
Chan Ming Sam and Chan Ming S
Purchase Details
Closed on
Jul 10, 2004
Sold by
Lee Biky
Bought by
Chan Ming Sam and Chan Ming S
Purchase Details
Closed on
Jun 29, 2004
Sold by
Chan Dorothy
Bought by
Chan Ming Sam and Chan Ming S
Purchase Details
Closed on
Jun 23, 2004
Sold by
Chan Kenny
Bought by
Chan Ming Sam and Chan Ming S
Purchase Details
Closed on
Jun 21, 2004
Sold by
Chan Kwan Yim and Chan Kwan Y
Bought by
Chan Ming Sam and Chan Ming S
Purchase Details
Closed on
Jun 14, 2004
Sold by
Toy Boy Lon
Bought by
Chan Ming Sam and Chan Ming S
Create a Home Valuation Report for This Property
The Home Valuation Report is an in-depth analysis detailing your home's value as well as a comparison with similar homes in the area
Home Values in the Area
Average Home Value in this Area
Purchase History
| Date | Buyer | Sale Price | Title Company |
|---|---|---|---|
| Ming Chan Living Trust | -- | Attorney | |
| Chan Mark D | -- | None Available | |
| Chan Ming Sam | -- | -- | |
| Chan Ming Sam | -- | -- | |
| Chan Ming Sam | -- | -- | |
| Chan Ming Sam | -- | -- | |
| Chan Ming Sam | -- | -- | |
| Chan Ming Sam | -- | -- |
Source: Public Records
Tax History Compared to Growth
Tax History
| Year | Tax Paid | Tax Assessment Tax Assessment Total Assessment is a certain percentage of the fair market value that is determined by local assessors to be the total taxable value of land and additions on the property. | Land | Improvement |
|---|---|---|---|---|
| 2025 | $4,199 | $241,912 | $87,375 | $154,537 |
| 2024 | $3,832 | $226,022 | $75,000 | $151,022 |
| 2023 | $3,832 | $201,836 | $50,000 | $151,836 |
| 2022 | $3,331 | $183,161 | $45,000 | $138,161 |
| 2021 | $1,157 | $96,206 | $0 | $0 |
| 2020 | $1,141 | $94,878 | $0 | $0 |
| 2019 | $1,120 | $92,745 | $0 | $0 |
| 2018 | $1,099 | $91,016 | $0 | $0 |
| 2017 | $1,078 | $89,144 | $0 | $0 |
| 2016 | $1,065 | $87,311 | $0 | $0 |
| 2015 | $1,074 | $86,705 | $0 | $0 |
| 2014 | $1,082 | $86,017 | $0 | $0 |
Source: Public Records
Map
Nearby Homes
- 4641 Barnes Rd S
- 4450 Revelstoke Dr
- 5340 Santa Monica Blvd S
- 5604 Sabena Rd
- 5252 Santa Monica Blvd N
- 5937 Loran Dr N
- 5416 Lori Dr S
- 4123 Piper Dr
- 3064 Carrevero Dr W
- 5676 Flagstaff Rd
- 2510 Tebassa Rd
- 4143 Spring Glen Rd
- 3036 Skipper Ln
- 3042 Skipper Ln
- 2627 Sack Dr E
- 4262 Glenview Rd
- 3142 Scotty Dr
- 4746 Southgate Dr
- 2728 Elisa Dr E
- 3233 Crosby Ln
- 5538 Santa Monica Blvd S
- 5514 Santa Monica Blvd S
- 5544 Santa Monica Blvd S
- 4538 Begbie Dr
- 4533 Begbie Dr
- 5554 Santa Monica Blvd S
- 4603 Barnes Rd
- 4534 Vancouver Dr Unit 2
- 4537 Barnes Rd
- 4526 Begbie Dr
- 4519 Begbie Dr
- 5608 Santa Monica Blvd S
- 4524 Vancouver Dr
- 4527 Barnes Rd S
- 4527 Barnes Rd
- 4621 Barnes Rd
- 4516 Begbie Dr
- 4641 Barnes Rd
- 4643 Barnes Rd
- 4519 Barnes Rd