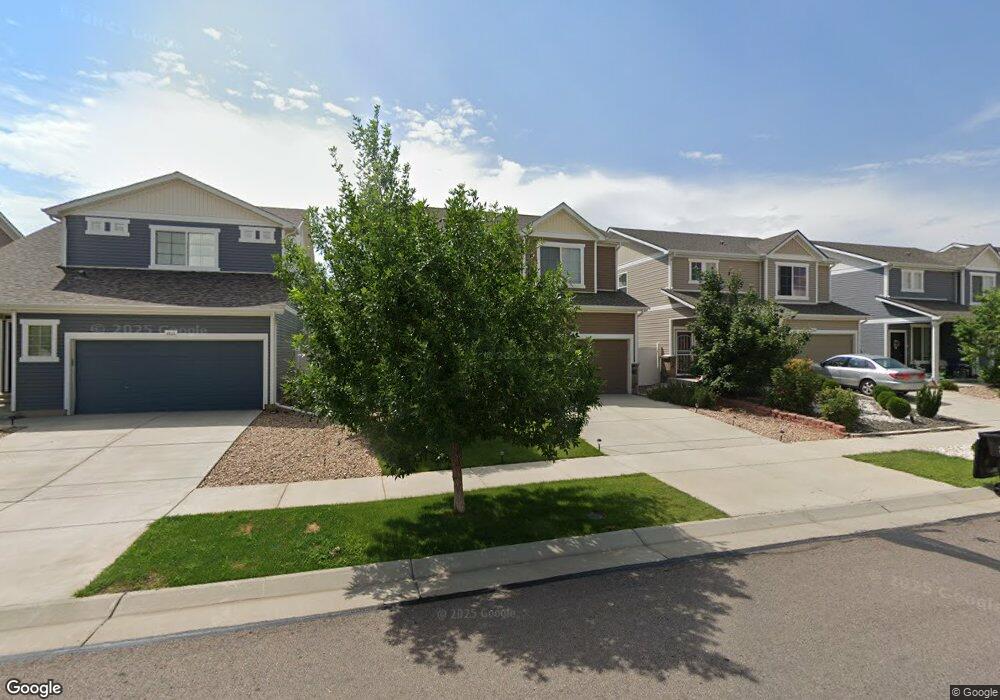
5537 Liverpool St Denver, CO 80249
Green Valley Ranch NeighborhoodEstimated Value: $498,000 - $539,000
4
Beds
4
Baths
2,279
Sq Ft
$225/Sq Ft
Est. Value
About This Home
This home is located at 5537 Liverpool St, Denver, CO 80249 and is currently estimated at $513,889, approximately $225 per square foot. 5537 Liverpool St is a home located in Denver County with nearby schools including Pitt-Waller K-8 School, McGlone Academy, and Marie L. Greenwood Academy.
Ownership History
Date
Name
Owned For
Owner Type
Purchase Details
Closed on
Mar 16, 2022
Sold by
Branden Craven
Bought by
Ayele Tinsae
Current Estimated Value
Home Financials for this Owner
Home Financials are based on the most recent Mortgage that was taken out on this home.
Original Mortgage
$522,500
Outstanding Balance
$487,797
Interest Rate
3.85%
Mortgage Type
New Conventional
Estimated Equity
$26,092
Purchase Details
Closed on
Aug 13, 2020
Sold by
Parrish Ingrid I and Parrish Ladarieus
Bought by
Craven Branden and Armstrong Candace
Home Financials for this Owner
Home Financials are based on the most recent Mortgage that was taken out on this home.
Original Mortgage
$386,650
Interest Rate
3%
Mortgage Type
FHA
Purchase Details
Closed on
Nov 4, 2011
Sold by
Oakwood Homes Llc
Bought by
Parrish Ingrid L and Parrish Ladarieus
Home Financials for this Owner
Home Financials are based on the most recent Mortgage that was taken out on this home.
Original Mortgage
$225,092
Interest Rate
4.08%
Mortgage Type
VA
Create a Home Valuation Report for This Property
The Home Valuation Report is an in-depth analysis detailing your home's value as well as a comparison with similar homes in the area
Home Values in the Area
Average Home Value in this Area
Purchase History
| Date | Buyer | Sale Price | Title Company |
|---|---|---|---|
| Ayele Tinsae | $560,000 | First American Title | |
| Craven Branden | $400,000 | Chicago Title | |
| Parrish Ingrid L | $217,900 | Town & Country Title Service |
Source: Public Records
Mortgage History
| Date | Status | Borrower | Loan Amount |
|---|---|---|---|
| Open | Ayele Tinsae | $522,500 | |
| Previous Owner | Craven Branden | $386,650 | |
| Previous Owner | Parrish Ingrid L | $225,092 |
Source: Public Records
Tax History Compared to Growth
Tax History
| Year | Tax Paid | Tax Assessment Tax Assessment Total Assessment is a certain percentage of the fair market value that is determined by local assessors to be the total taxable value of land and additions on the property. | Land | Improvement |
|---|---|---|---|---|
| 2024 | $4,093 | $31,990 | $250 | $31,740 |
| 2023 | $3,939 | $31,990 | $250 | $31,740 |
| 2022 | $3,680 | $27,640 | $3,540 | $24,100 |
| 2021 | $3,399 | $28,440 | $3,640 | $24,800 |
| 2020 | $3,380 | $25,510 | $3,640 | $21,870 |
| 2019 | $3,327 | $25,510 | $3,640 | $21,870 |
| 2018 | $3,060 | $22,600 | $2,250 | $20,350 |
| 2017 | $3,797 | $22,600 | $2,250 | $20,350 |
| 2016 | $3,289 | $19,870 | $2,181 | $17,689 |
Source: Public Records
Map
Nearby Homes
- 5556 Liverpool St
- 5550 Malta St
- 5535 Nepal St
- 5567 Malta St
- 21313 E 55th Ave
- 5562 Killarney St
- 5293 Malaya St
- 5572 Killarney St
- 5571 Killarney St
- 5655 Killarney Ct
- 20476 Robins Dr
- Plan 2804 at Painted Prairie
- Plan 2803 at Painted Prairie
- Plan 2802 at Painted Prairie
- Plan 2805 at Painted Prairie
- Glenwood Plan at Painted Prairie - Durango Collection
- Dillon Plan at Painted Prairie - The Summit Collection
- Avon Plan at Painted Prairie - The Summit Collection
- Flatiron Plan at Painted Prairie - The Summit Collection
- Carbondale Plan at Painted Prairie - The Summit Collection
- 5539 Liverpool St
- 5535 Liverpool St
- 5543 Liverpool St
- 5533 Liverpool St
- 5540 Lisbon St
- 5545 Liverpool St
- 5542 Lisbon St
- 5534 Lisbon St
- 5542 Liverpool St
- 5544 Liverpool St
- 5530 Lisbon St
- 5544 Lisbon St
- 5534 Liverpool St
- 5547 Liverpool St
- 5546 Liverpool St
- 5546 Lisbon St
- 5532 Liverpool St
- 5548 Liverpool St
- 5549 Liverpool St
- 5550 Liverpool St