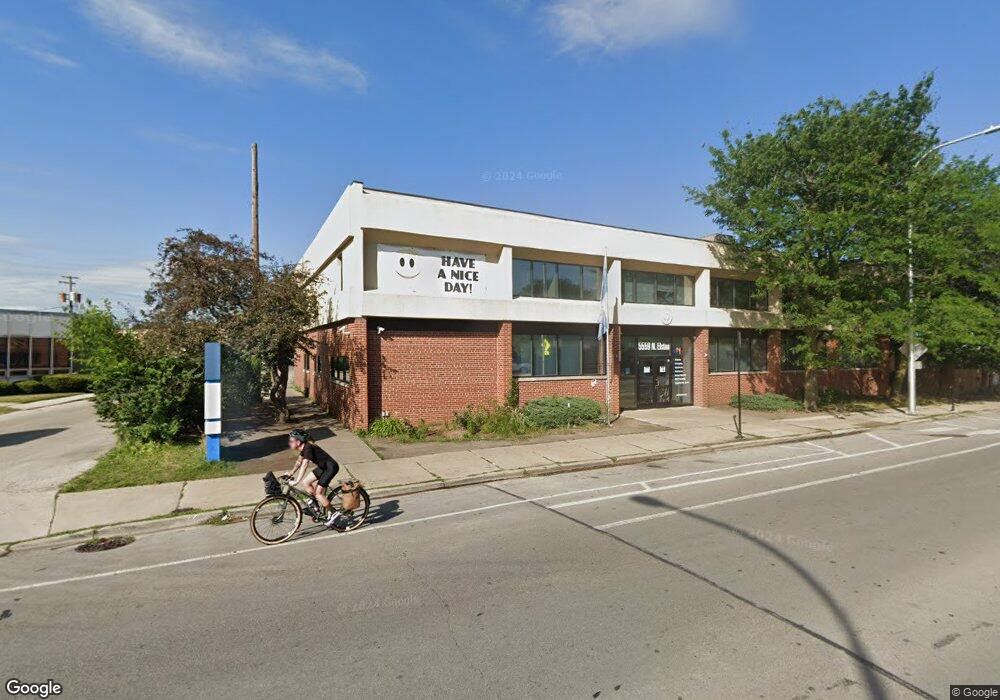
5559 N Elston Ave Chicago, IL 60630
Jefferson Park NeighborhoodEstimated Value: $2,505,478
--
Bed
--
Bath
--
Sq Ft
0.5
Acres
About This Home
This home is located at 5559 N Elston Ave, Chicago, IL 60630 and is currently estimated at $2,505,478. 5559 N Elston Ave is a home located in Cook County with nearby schools including Farnsworth Elementary School, William Howard Taft High School, and St. Constance School.
Ownership History
Date
Name
Owned For
Owner Type
Purchase Details
Closed on
Nov 24, 2021
Sold by
Hampton Realty Management Llc
Bought by
Dehayes Capital Group Llc
Current Estimated Value
Purchase Details
Closed on
Sep 14, 2012
Sold by
Northside Community Bank
Bought by
Hampton Management Llc
Purchase Details
Closed on
May 31, 2011
Sold by
Elston Foster Llc
Bought by
Northside Community Bank
Purchase Details
Closed on
Sep 11, 2006
Sold by
Lobo Chgo Properties Llc
Bought by
Elston Foster Llc
Home Financials for this Owner
Home Financials are based on the most recent Mortgage that was taken out on this home.
Original Mortgage
$1,544,000
Interest Rate
8.25%
Mortgage Type
Construction
Purchase Details
Closed on
Jun 28, 2004
Sold by
Amalgamated Bank Of Chicago
Bought by
Lobo Chgo Properties Llc
Create a Home Valuation Report for This Property
The Home Valuation Report is an in-depth analysis detailing your home's value as well as a comparison with similar homes in the area
Home Values in the Area
Average Home Value in this Area
Purchase History
| Date | Buyer | Sale Price | Title Company |
|---|---|---|---|
| Dehayes Capital Group Llc | $1,900,000 | Chicago Title | |
| Hampton Management Llc | $724,500 | None Available | |
| Northside Community Bank | $1,956,000 | None Available | |
| Elston Foster Llc | $1,250,000 | None Available | |
| Lobo Chgo Properties Llc | $50,000 | Stg |
Source: Public Records
Mortgage History
| Date | Status | Borrower | Loan Amount |
|---|---|---|---|
| Previous Owner | Elston Foster Llc | $1,544,000 |
Source: Public Records
Tax History Compared to Growth
Tax History
| Year | Tax Paid | Tax Assessment Tax Assessment Total Assessment is a certain percentage of the fair market value that is determined by local assessors to be the total taxable value of land and additions on the property. | Land | Improvement |
|---|---|---|---|---|
| 2024 | $68,543 | $312,792 | $83,531 | $229,261 |
| 2023 | $66,819 | $324,868 | $100,238 | $224,630 |
| 2022 | $66,819 | $324,868 | $100,238 | $224,630 |
| 2021 | $65,327 | $324,865 | $100,237 | $224,628 |
| 2020 | $50,014 | $224,509 | $100,237 | $124,272 |
| 2019 | $45,107 | $224,509 | $100,237 | $124,272 |
| 2018 | $44,348 | $224,509 | $100,237 | $124,272 |
| 2017 | $39,018 | $181,250 | $87,707 | $93,543 |
| 2016 | $36,302 | $181,250 | $87,707 | $93,543 |
| 2015 | $33,213 | $181,250 | $87,707 | $93,543 |
| 2014 | $34,733 | $187,199 | $87,707 | $99,492 |
| 2013 | $34,047 | $187,199 | $87,707 | $99,492 |
Source: Public Records
Map
Nearby Homes
- 5233 W Olive Ave
- 5510 N Luna Ave
- 5448 N Lieb Ave
- 5626 N Central Ave
- 5700 N Central Ave
- 5657 N Parkside Ave
- 5700 N Parkside Ave
- 5523 N Major Ave
- 5620 N Major Ave
- 5883 N Central Ave
- 5722 N Leonard Ave
- 5600 N Mango Ave
- 5312 N Leamington Ave
- 5774 N Elston Ave
- 5252 N Leamington Ave
- 5787 N Clifford Ave
- 9530 N Lamon Ave Unit 403
- 5151 W Winona St
- 5342 W Winnemac Ave
- 6033 N Leader Ave
- 5565 N Elston Ave
- 5562 N Elston Ave
- 5527 N Long Ave
- 5572 N Elston Ave
- 5572 N Elston Ave Unit 1
- 5572 N Elston Ave Unit 2
- 5572 N Elston Ave
- 5523 N Long Ave
- 5576 N Elston Ave
- 5521 N Long Ave
- 5526 N Long Ave
- 5536 N Elston Ave
- 5563 N Elston Ave
- 5567 N Elston Ave
- 5517 N Long Ave
- 5517 N Long Ave
- 5520 N Long Ave
- 5539 N Lotus Ave
- 5513 N Long Ave
- 5543 N Lotus Ave