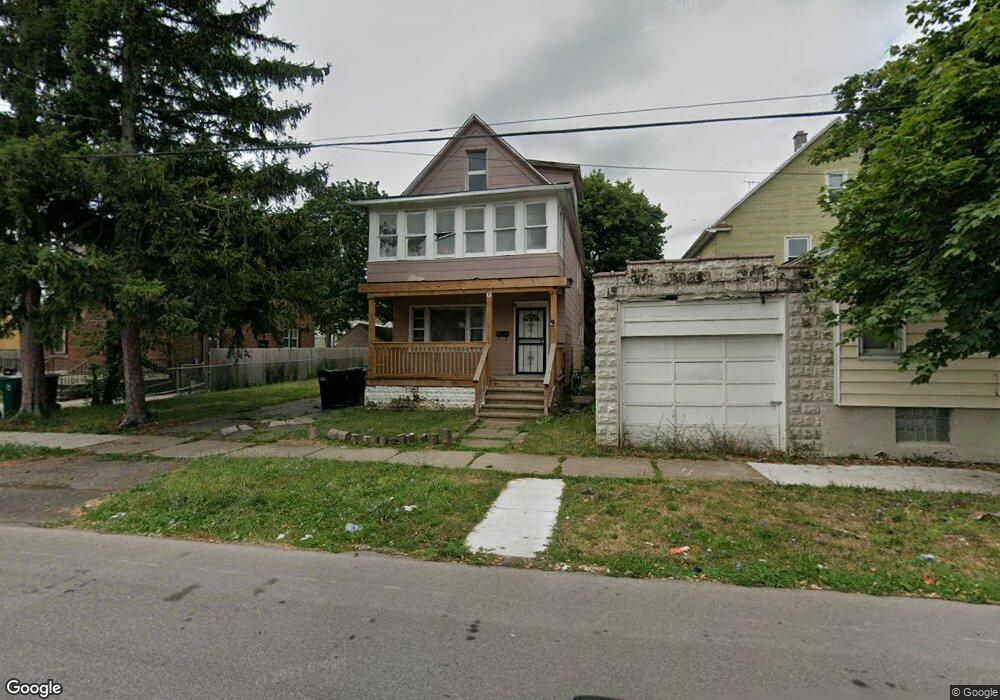
556 20th St Niagara Falls, NY 14301
South End NeighborhoodEstimated Value: $87,532 - $136,000
2
Beds
2
Baths
1,850
Sq Ft
$59/Sq Ft
Est. Value
About This Home
This home is located at 556 20th St, Niagara Falls, NY 14301 and is currently estimated at $108,383, approximately $58 per square foot. 556 20th St is a home located in Niagara County with nearby schools including Niagara Falls High School and St. Joseph Elementary School.
Ownership History
Date
Name
Owned For
Owner Type
Purchase Details
Closed on
May 24, 2006
Sold by
Polak Susan
Bought by
Polak Joseph
Current Estimated Value
Purchase Details
Closed on
Oct 18, 2005
Sold by
Secretary Of Housing & Ur
Bought by
Polak Susan
Purchase Details
Closed on
Sep 15, 2004
Sold by
Homeside Lending Inc
Bought by
Secretary Of Hud
Purchase Details
Closed on
Oct 1, 2002
Sold by
Faultersack Richard L
Bought by
Homeside Lending Inc
Purchase Details
Closed on
Jan 7, 1999
Sold by
Cesari Ann C
Bought by
Faultersack Richard L
Create a Home Valuation Report for This Property
The Home Valuation Report is an in-depth analysis detailing your home's value as well as a comparison with similar homes in the area
Home Values in the Area
Average Home Value in this Area
Purchase History
| Date | Buyer | Sale Price | Title Company |
|---|---|---|---|
| Polak Joseph | -- | Melanie Tisdale | |
| Polak Susan | $16,051 | Melanie Tisdale | |
| Secretary Of Hud | $52,633 | Shapiro & Dicaro | |
| Homeside Lending Inc | $52,633 | -- | |
| Faultersack Richard L | $35,000 | -- |
Source: Public Records
Tax History Compared to Growth
Tax History
| Year | Tax Paid | Tax Assessment Tax Assessment Total Assessment is a certain percentage of the fair market value that is determined by local assessors to be the total taxable value of land and additions on the property. | Land | Improvement |
|---|---|---|---|---|
| 2024 | $2,001 | $25,600 | $3,100 | $22,500 |
| 2023 | $1,368 | $25,600 | $3,100 | $22,500 |
| 2022 | $749 | $25,600 | $3,100 | $22,500 |
| 2021 | $749 | $25,600 | $3,100 | $22,500 |
| 2020 | $497 | $25,600 | $3,100 | $22,500 |
| 2019 | $935 | $25,600 | $3,100 | $22,500 |
| 2018 | $736 | $25,600 | $3,100 | $22,500 |
| 2017 | $935 | $25,600 | $3,100 | $22,500 |
| 2016 | $5,846 | $25,600 | $3,100 | $22,500 |
| 2015 | -- | $25,600 | $3,100 | $22,500 |
| 2014 | -- | $8,100 | $3,100 | $5,000 |
Source: Public Records
Map
Nearby Homes