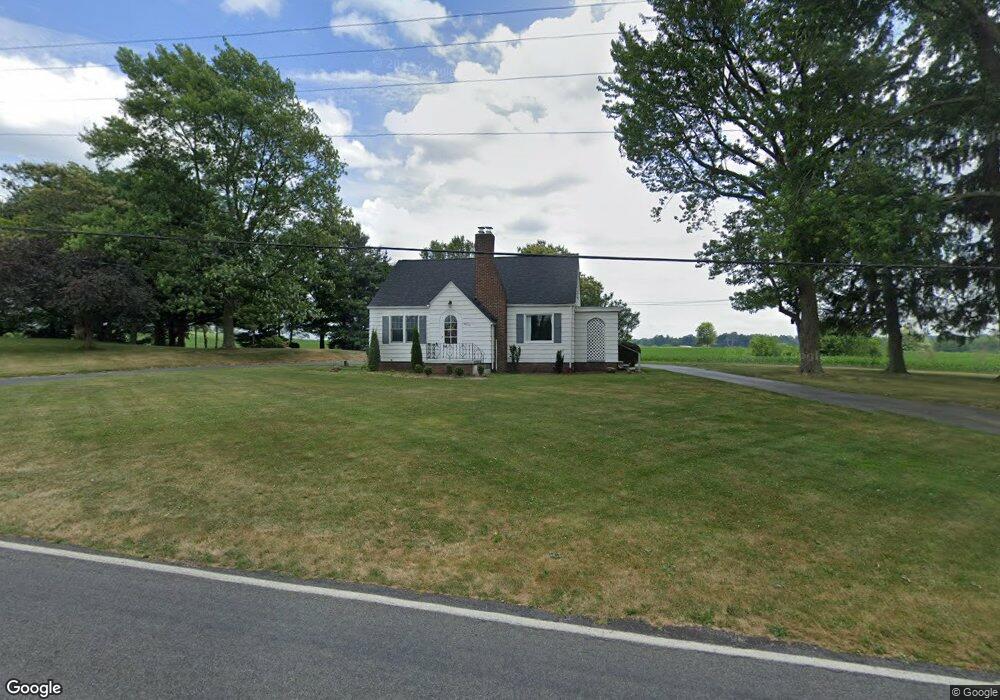
5570 Meese Rd NE Louisville, OH 44641
Estimated Value: $133,000 - $217,717
4
Beds
1
Bath
1,366
Sq Ft
$126/Sq Ft
Est. Value
About This Home
This home is located at 5570 Meese Rd NE, Louisville, OH 44641 and is currently estimated at $172,679, approximately $126 per square foot. 5570 Meese Rd NE is a home located in Stark County with nearby schools including Louisville High School.
Ownership History
Date
Name
Owned For
Owner Type
Purchase Details
Closed on
Apr 30, 2024
Sold by
Haines Andrew T and Haines Kelly E
Bought by
Campbell Jacob A and Filisky Phoebe J
Current Estimated Value
Home Financials for this Owner
Home Financials are based on the most recent Mortgage that was taken out on this home.
Original Mortgage
$130,656
Outstanding Balance
$128,820
Interest Rate
6.87%
Mortgage Type
New Conventional
Estimated Equity
$43,859
Purchase Details
Closed on
Oct 9, 2019
Sold by
Joe & Pat Llc
Bought by
Haines Andrew T and Haines Kelly E
Home Financials for this Owner
Home Financials are based on the most recent Mortgage that was taken out on this home.
Original Mortgage
$120,000
Interest Rate
3.5%
Mortgage Type
New Conventional
Purchase Details
Closed on
Apr 20, 2018
Sold by
Roberts Steven
Bought by
Joe & Pat Llc
Purchase Details
Closed on
Sep 22, 2016
Sold by
Roberts John R and Roberts Jean D
Bought by
Roberts Steven and John And Jean Roberts Irrevocable Trust
Create a Home Valuation Report for This Property
The Home Valuation Report is an in-depth analysis detailing your home's value as well as a comparison with similar homes in the area
Home Values in the Area
Average Home Value in this Area
Purchase History
| Date | Buyer | Sale Price | Title Company |
|---|---|---|---|
| Campbell Jacob A | $170,000 | Heritage Union Title | |
| Haines Andrew T | $134,000 | None Available | |
| Joe & Pat Llc | $100,000 | None Available | |
| Roberts Steven | -- | None Available |
Source: Public Records
Mortgage History
| Date | Status | Borrower | Loan Amount |
|---|---|---|---|
| Open | Campbell Jacob A | $130,656 | |
| Previous Owner | Haines Andrew T | $120,000 |
Source: Public Records
Tax History Compared to Growth
Tax History
| Year | Tax Paid | Tax Assessment Tax Assessment Total Assessment is a certain percentage of the fair market value that is determined by local assessors to be the total taxable value of land and additions on the property. | Land | Improvement |
|---|---|---|---|---|
| 2025 | -- | $39,840 | $12,150 | $27,690 |
| 2024 | -- | $39,840 | $12,150 | $27,690 |
| 2023 | $1,699 | $34,940 | $10,750 | $24,190 |
| 2022 | $1,705 | $34,940 | $10,750 | $24,190 |
| 2021 | $1,710 | $34,940 | $10,750 | $24,190 |
| 2020 | $1,465 | $31,610 | $9,700 | $21,910 |
| 2019 | $1,480 | $30,990 | $9,700 | $21,290 |
| 2018 | $1,476 | $30,990 | $9,700 | $21,290 |
| 2017 | $1,371 | $27,480 | $9,070 | $18,410 |
| 2016 | $1,109 | $32,070 | $9,070 | $23,000 |
| 2015 | $1,112 | $32,070 | $9,070 | $23,000 |
| 2014 | $991 | $27,970 | $7,910 | $20,060 |
| 2013 | $499 | $27,970 | $7,910 | $20,060 |
Source: Public Records
Map
Nearby Homes
- 5495 Meese Rd NE
- 6052 N Nickelplate St
- 5765 Maplegrove St
- 2015 E Main St
- 203 Brookfield St
- 0 Michigan Blvd
- 1170 Winding Ridge Ave
- 910 Crosswyck Cir
- 1812 E Broad St
- 1715 High St
- 316 E Reno Dr
- 2110 Edmar St
- 308 Superior St
- 5474 Ravenna Ave
- 641 S Nickelplate St
- 325 Lincoln Ave
- 428 Honeycrisp Dr NE
- 3047 Mcintosh Dr NE
- 432 Honeycrisp Dr NE
- 2962 Mcintosh Dr NE
- 5596 Meese Rd NE
- 5601 Meese Rd
- 0 Meese Rd NE Unit 3052618
- 0 Meese Rd NE Unit 3143284
- 0 Meese Rd NE Unit 3288427
- 0 Meese Rd NE Unit 3678327
- 0000 Meese Rd NE
- 0 Meese Rd NE Unit 4045495
- 0 Meese Rd NE Unit 3932047
- 5631 Meese Rd NE
- 5440 Eshelman St
- 5490 Meese Rd NE
- 5356 Eshelman St
- 5702 Meese Rd
- 5702 Meese Rd NE
- 0 Meese Rd NE
- 5721 Schloneger Dr
- 5473 Meese Rd NE
- 5363 Eshelman St
- 5327 Eshelman St