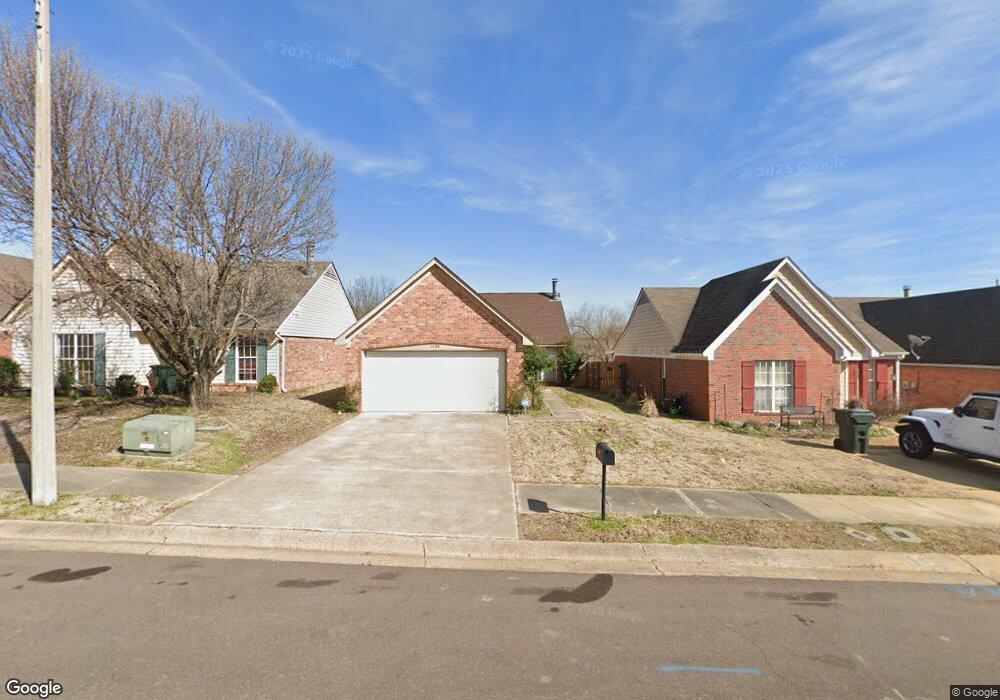
5584 Donald Dr Southaven, MS 38671
Estimated Value: $215,000 - $222,255
2
Beds
2
Baths
1,288
Sq Ft
$169/Sq Ft
Est. Value
About This Home
This home is located at 5584 Donald Dr, Southaven, MS 38671 and is currently estimated at $218,314, approximately $169 per square foot. 5584 Donald Dr is a home located in DeSoto County with nearby schools including Hope Sullivan Elementary School, Southaven Intermediate School, and Southaven Middle School.
Ownership History
Date
Name
Owned For
Owner Type
Purchase Details
Closed on
Jul 29, 2022
Sold by
Anderson Paula S and Anderson Gary
Bought by
Park Place Ob Inc
Current Estimated Value
Home Financials for this Owner
Home Financials are based on the most recent Mortgage that was taken out on this home.
Original Mortgage
$151,608
Outstanding Balance
$63,259
Interest Rate
5.7%
Mortgage Type
New Conventional
Estimated Equity
$155,055
Purchase Details
Closed on
Dec 29, 2021
Sold by
Dawkins Llc
Bought by
Anderson Paula S
Purchase Details
Closed on
Mar 5, 2015
Sold by
Bakeris Shea
Bought by
Dawkins Llc
Purchase Details
Closed on
May 4, 2009
Sold by
Powers Richard L
Bought by
Powers Richard Lee and Ellis Heidi M
Home Financials for this Owner
Home Financials are based on the most recent Mortgage that was taken out on this home.
Original Mortgage
$50,000
Interest Rate
4.89%
Mortgage Type
Stand Alone Refi Refinance Of Original Loan
Create a Home Valuation Report for This Property
The Home Valuation Report is an in-depth analysis detailing your home's value as well as a comparison with similar homes in the area
Home Values in the Area
Average Home Value in this Area
Purchase History
| Date | Buyer | Sale Price | Title Company |
|---|---|---|---|
| Park Place Ob Inc | -- | None Listed On Document | |
| Anderson Paula S | -- | None Available | |
| Dawkins Llc | -- | First National Financial Tit | |
| Powers Richard Lee | -- | None Available |
Source: Public Records
Mortgage History
| Date | Status | Borrower | Loan Amount |
|---|---|---|---|
| Open | Park Place Ob Inc | $151,608 | |
| Previous Owner | Powers Richard Lee | $50,000 |
Source: Public Records
Tax History Compared to Growth
Tax History
| Year | Tax Paid | Tax Assessment Tax Assessment Total Assessment is a certain percentage of the fair market value that is determined by local assessors to be the total taxable value of land and additions on the property. | Land | Improvement |
|---|---|---|---|---|
| 2024 | $2,085 | $14,352 | $3,750 | $10,602 |
| 2023 | $2,085 | $14,352 | $0 | $0 |
| 2022 | $2,042 | $14,352 | $3,750 | $10,602 |
| 2021 | $2,042 | $14,352 | $3,750 | $10,602 |
| 2020 | $1,921 | $13,503 | $3,750 | $9,753 |
| 2019 | $1,921 | $13,503 | $3,750 | $9,753 |
| 2017 | $1,969 | $23,794 | $13,772 | $10,022 |
| 2016 | $1,969 | $9,182 | $2,500 | $6,682 |
| 2015 | $1,308 | $15,864 | $9,182 | $6,682 |
| 2014 | $1,316 | $9,182 | $0 | $0 |
| 2013 | $1,316 | $9,182 | $0 | $0 |
Source: Public Records
Map
Nearby Homes
- 5379 Bradley Dr
- 672 Grant Dr
- 5448 Pollard Dr
- 5353 Pollard Dr
- 5330 Kalian Cove
- 5353 Kristy Ln
- 5339 Kristy Ln
- 5393 Peppermill Dr
- 5381 Peppermill Dr
- 0 Pepper Chase Dr
- 6275 U S Highway 51
- 1652 Thomas St
- 1664 Thomas St
- 5893 Kayla Dr
- 1784 Thomas St
- 1876 Greeno Dr
- 6433 Arbor Lake Dr W
- 1926 Tissington Dr
- 1939 Ingleside Cove
- 5512 Alexandria Ln