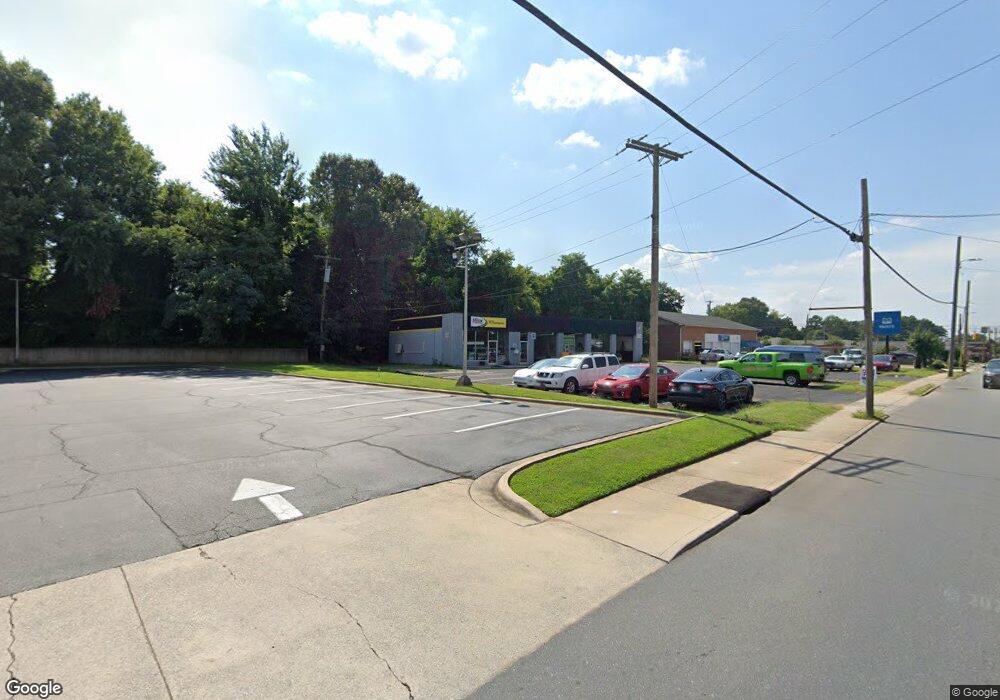
559 Church St N Concord, NC 28025
Estimated Value: $680,801
--
Bed
--
Bath
3,510
Sq Ft
$194/Sq Ft
Est. Value
About This Home
This home is located at 559 Church St N, Concord, NC 28025 and is currently estimated at $680,801, approximately $193 per square foot. 559 Church St N is a home located in Cabarrus County with nearby schools including Beverly Hills STEM Elementary, Concord Middle School, and Concord High School.
Ownership History
Date
Name
Owned For
Owner Type
Purchase Details
Closed on
Nov 2, 2022
Sold by
Drive Nc 2020 Inc
Bought by
Mai Investment Group Llc
Current Estimated Value
Purchase Details
Closed on
Nov 23, 2020
Sold by
Red Paper Clip Llc
Bought by
Drive Nc 2020 Inc
Home Financials for this Owner
Home Financials are based on the most recent Mortgage that was taken out on this home.
Original Mortgage
$743,000
Interest Rate
2.8%
Mortgage Type
Commercial
Purchase Details
Closed on
Jan 8, 2015
Sold by
The Morganford Group Llc
Bought by
Red Paper Clip Llc
Home Financials for this Owner
Home Financials are based on the most recent Mortgage that was taken out on this home.
Original Mortgage
$325,060
Interest Rate
4.04%
Mortgage Type
Future Advance Clause Open End Mortgage
Purchase Details
Closed on
Nov 7, 2007
Sold by
Coley Jordan Enterprises Llc
Bought by
The Morganford Group Llc and Red Paper Clip Llc
Home Financials for this Owner
Home Financials are based on the most recent Mortgage that was taken out on this home.
Original Mortgage
$348,786
Interest Rate
6.37%
Mortgage Type
Seller Take Back
Purchase Details
Closed on
Dec 30, 1997
Sold by
Cjh Properties
Bought by
Coley Jordan Enterprises Llc
Create a Home Valuation Report for This Property
The Home Valuation Report is an in-depth analysis detailing your home's value as well as a comparison with similar homes in the area
Home Values in the Area
Average Home Value in this Area
Purchase History
| Date | Buyer | Sale Price | Title Company |
|---|---|---|---|
| Mai Investment Group Llc | $610,000 | -- | |
| Drive Nc 2020 Inc | $535,000 | None Availablei | |
| Red Paper Clip Llc | $240,000 | None Available | |
| The Morganford Group Llc | $450,000 | None Available | |
| Coley Jordan Enterprises Llc | -- | -- |
Source: Public Records
Mortgage History
| Date | Status | Borrower | Loan Amount |
|---|---|---|---|
| Previous Owner | Drive Nc 2020 Inc | $743,000 | |
| Previous Owner | Red Paper Clip Llc | $325,060 | |
| Previous Owner | The Morganford Group Llc | $348,786 |
Source: Public Records
Tax History Compared to Growth
Tax History
| Year | Tax Paid | Tax Assessment Tax Assessment Total Assessment is a certain percentage of the fair market value that is determined by local assessors to be the total taxable value of land and additions on the property. | Land | Improvement |
|---|---|---|---|---|
| 2025 | $6,159 | $618,380 | $295,590 | $322,790 |
| 2024 | $6,159 | $618,380 | $295,590 | $322,790 |
| 2023 | $5,198 | $426,050 | $181,900 | $244,150 |
| 2022 | $5,198 | $426,050 | $181,900 | $244,150 |
| 2021 | $5,198 | $426,050 | $181,900 | $244,150 |
| 2020 | $5,189 | $425,360 | $181,210 | $244,150 |
| 2019 | $4,308 | $353,090 | $215,760 | $137,330 |
| 2018 | $4,237 | $353,090 | $215,760 | $137,330 |
| 2017 | $4,166 | $353,090 | $215,760 | $137,330 |
| 2016 | $2,472 | $371,340 | $210,370 | $160,970 |
| 2015 | $4,382 | $371,340 | $210,370 | $160,970 |
| 2014 | $4,382 | $371,340 | $210,370 | $160,970 |
Source: Public Records
Map
Nearby Homes
- 19 Todd Dr NE
- 101 Todd Dr NW
- 636 Forest St NW
- 63 Brookwood Ave NW
- 642 Forest St NW
- 722 Wilmar St NW
- 138 Tetbury Ave NE
- 158 Spencer Ave NW
- 584 Allison St NW
- 606 Camrose Cir NE
- 152 Phifer Ave NW
- 629 Camrose Cir NE Unit 45
- 172 Brookwood Ave NW
- 528 Gibson Dr NW
- 649 Camrose Cir NE
- 653 Camrose Cir NE
- 1 Buffalo Ave NW Unit 81
- 159 Madison Ave NE
- 169 Freeze Ave NW
- 590 Harris St NW
- 558 Church St N
- 552 Newell St NW
- 546 Newell St NW
- 559 Newell St NW
- 555 Newell St NW
- 551 Newell St NW
- 571 Hyde Park Dr NE
- 536 Church St N
- 563 Hyde Park Dr NE
- 587 Church St N
- 555 Hyde Park Dr NE
- 579 Hyde Park Dr NE
- 579 Hyde Park Dr NE Unit 211
- 20 Todd Dr NW
- 45 Winecoff Ave NW
- 547 Newell St NW
- 561 Newell St NW
- 551 Hyde Park Dr NE
- 26 Todd Dr NW
- 545 Newell St NW