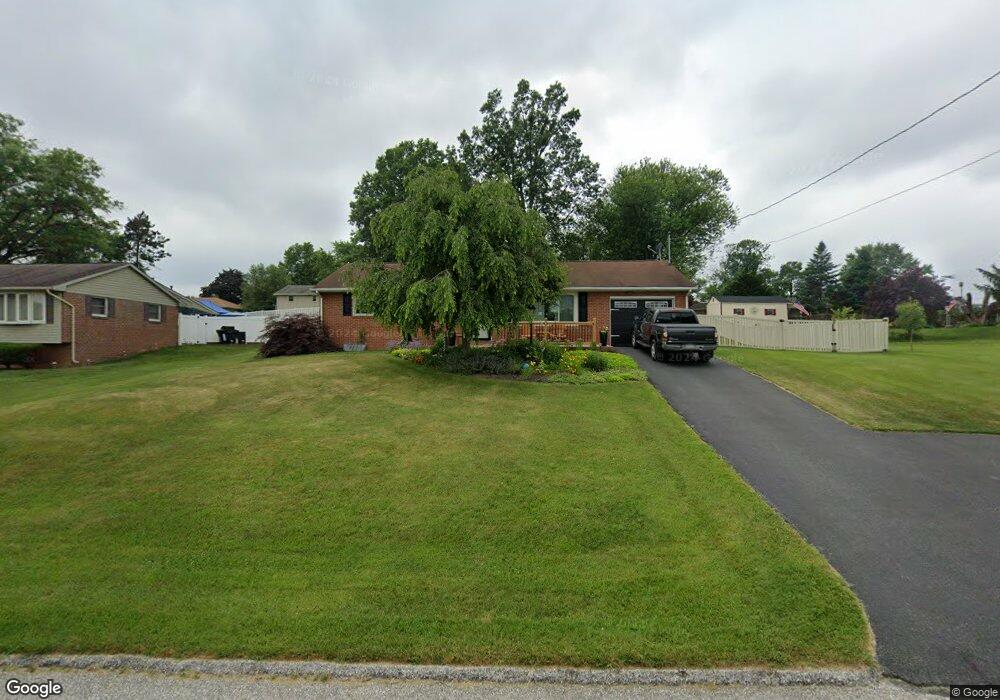
559 E Heatherfield Way Red Lion, PA 17356
Estimated Value: $282,000 - $389,000
3
Beds
2
Baths
2,529
Sq Ft
$130/Sq Ft
Est. Value
About This Home
This home is located at 559 E Heatherfield Way, Red Lion, PA 17356 and is currently estimated at $327,900, approximately $129 per square foot. 559 E Heatherfield Way is a home located in York County with nearby schools including Larry J. Macaluso Elementary School, Red Lion Area Junior High School, and Red Lion Area Senior High School.
Ownership History
Date
Name
Owned For
Owner Type
Purchase Details
Closed on
Aug 30, 2011
Sold by
Smith Philip E and Smith Connie L
Bought by
Perry Sheila J
Current Estimated Value
Home Financials for this Owner
Home Financials are based on the most recent Mortgage that was taken out on this home.
Original Mortgage
$184,981
Outstanding Balance
$128,236
Interest Rate
4.52%
Mortgage Type
FHA
Estimated Equity
$199,664
Purchase Details
Closed on
Jun 16, 2006
Sold by
Abbott Alice M
Bought by
Smith Philip E and Smith Connie L
Home Financials for this Owner
Home Financials are based on the most recent Mortgage that was taken out on this home.
Original Mortgage
$125,000
Interest Rate
6.62%
Mortgage Type
Purchase Money Mortgage
Purchase Details
Closed on
Oct 4, 2005
Sold by
Newcomer Alice M
Bought by
Abbott Alice M
Purchase Details
Closed on
Dec 11, 2003
Sold by
Newcomer Robert F and Newcomer Alice M
Bought by
Newcomer Alice M
Create a Home Valuation Report for This Property
The Home Valuation Report is an in-depth analysis detailing your home's value as well as a comparison with similar homes in the area
Home Values in the Area
Average Home Value in this Area
Purchase History
| Date | Buyer | Sale Price | Title Company |
|---|---|---|---|
| Perry Sheila J | $189,800 | None Available | |
| Smith Philip E | $181,000 | None Available | |
| Abbott Alice M | -- | None Available | |
| Newcomer Alice M | -- | -- |
Source: Public Records
Mortgage History
| Date | Status | Borrower | Loan Amount |
|---|---|---|---|
| Open | Perry Sheila J | $184,981 | |
| Previous Owner | Smith Philip E | $125,000 |
Source: Public Records
Tax History Compared to Growth
Tax History
| Year | Tax Paid | Tax Assessment Tax Assessment Total Assessment is a certain percentage of the fair market value that is determined by local assessors to be the total taxable value of land and additions on the property. | Land | Improvement |
|---|---|---|---|---|
| 2025 | $3,897 | $124,660 | $38,490 | $86,170 |
| 2024 | $3,743 | $124,660 | $38,490 | $86,170 |
| 2023 | $3,743 | $124,660 | $38,490 | $86,170 |
| 2022 | $3,743 | $124,660 | $38,490 | $86,170 |
| 2021 | $3,637 | $124,660 | $38,490 | $86,170 |
| 2020 | $3,637 | $124,660 | $38,490 | $86,170 |
| 2019 | $3,625 | $124,660 | $38,490 | $86,170 |
| 2018 | $3,606 | $124,660 | $38,490 | $86,170 |
| 2017 | $3,575 | $124,660 | $38,490 | $86,170 |
| 2016 | $0 | $124,660 | $38,490 | $86,170 |
| 2015 | -- | $124,660 | $38,490 | $86,170 |
| 2014 | -- | $124,660 | $38,490 | $86,170 |
Source: Public Records
Map
Nearby Homes
- 705 Danbury Dr
- 306 Mohawk Dr
- Lot #10 Barclay Dr
- 325 Barclay Dr
- 375 Barclay Dr
- 1815 Windsor Rd
- 201 Overview Cir W
- 44 Hunters Run Ct Unit 8
- 369 Sunbury Way
- 1275 Dietz Rd
- 115 Ava Dr
- 1012 Woodridge Rd
- Woodford Plan at Kensington
- Sebastian Plan at Kensington
- Harrison Plan at Kensington
- Savannah Plan at Kensington
- Covington Plan at Kensington
- Nottingham Plan at Kensington
- Brentwood Plan at Kensington
- Caldwell Plan at Kensington
- 561 E Heatherfield Way
- 551 E Heatherfield Way
- 537 W Heatherfield Way
- 535 W Heatherfield Way
- 541 W Heatherfield Way
- 558 E Heatherfield Way
- 556 E Heatherfield Way
- 560 E Heatherfield Way
- 533 W Heatherfield Way
- 565 E Heatherfield Way
- 554 E Heatherfield Way
- 562 E Heatherfield Way
- 531 W Heatherfield Way
- 536 W Heatherfield Way
- 564 E Heatherfield Way
- 552 E Heatherfield Way
- 538 W Heatherfield Way
- 548 E Heatherfield Way
- 567 E Heatherfield Way
- 534 W Heatherfield Way