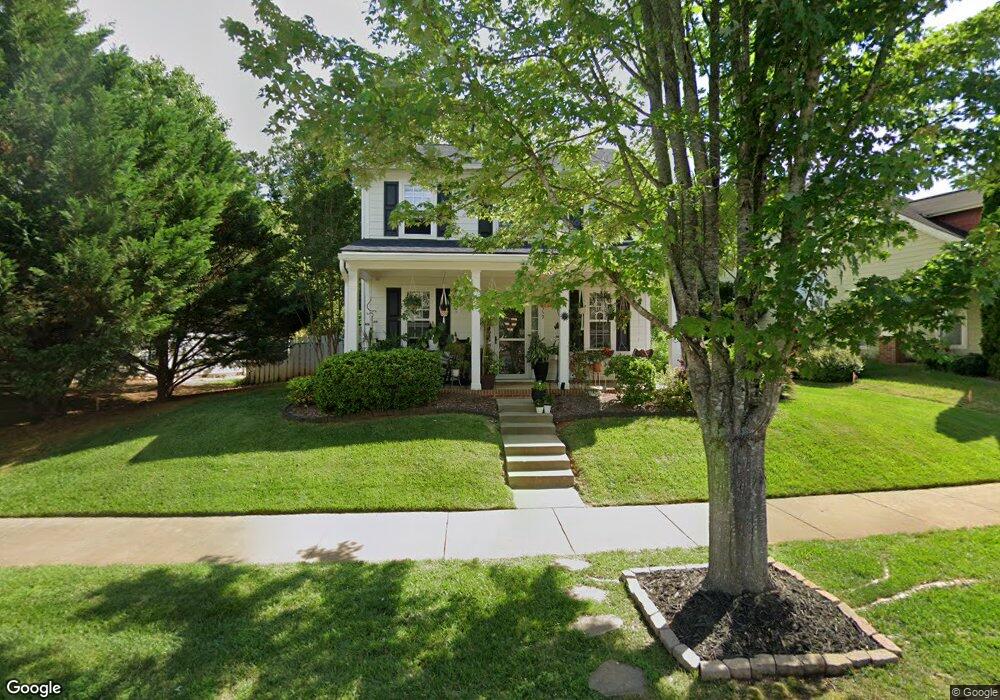
559 Millbrook Dr Pittsboro, NC 27312
Estimated Value: $349,000 - $388,000
3
Beds
2
Baths
1,441
Sq Ft
$255/Sq Ft
Est. Value
About This Home
This home is located at 559 Millbrook Dr, Pittsboro, NC 27312 and is currently estimated at $367,933, approximately $255 per square foot. 559 Millbrook Dr is a home located in Chatham County with nearby schools including Pittsboro Elementary School, George Moses Horton Middle School, and Northwood High.
Ownership History
Date
Name
Owned For
Owner Type
Purchase Details
Closed on
Dec 17, 2019
Sold by
Andrade Diane
Bought by
Andrade Diane and Diane C Andrade Revocable Trus
Current Estimated Value
Purchase Details
Closed on
Aug 28, 2013
Sold by
Sevagian Callicutt Timothy Lee and Sevagian Callicutt Katelyn
Bought by
Andrade Diane C
Purchase Details
Closed on
Feb 15, 2012
Sold by
Grimm Catherine Holst and Grimm Sebastian
Bought by
Sevagian Callicutt Timothy Lee and Sevagian Callicutt Katelyn
Home Financials for this Owner
Home Financials are based on the most recent Mortgage that was taken out on this home.
Original Mortgage
$146,880
Interest Rate
3.9%
Mortgage Type
New Conventional
Create a Home Valuation Report for This Property
The Home Valuation Report is an in-depth analysis detailing your home's value as well as a comparison with similar homes in the area
Home Values in the Area
Average Home Value in this Area
Purchase History
| Date | Buyer | Sale Price | Title Company |
|---|---|---|---|
| Andrade Diane | -- | None Available | |
| Andrade Diane C | $143,000 | None Available | |
| Sevagian Callicutt Timothy Lee | $144,000 | None Available |
Source: Public Records
Mortgage History
| Date | Status | Borrower | Loan Amount |
|---|---|---|---|
| Previous Owner | Sevagian Callicutt Timothy Lee | $146,880 |
Source: Public Records
Tax History Compared to Growth
Tax History
| Year | Tax Paid | Tax Assessment Tax Assessment Total Assessment is a certain percentage of the fair market value that is determined by local assessors to be the total taxable value of land and additions on the property. | Land | Improvement |
|---|---|---|---|---|
| 2025 | $2,579 | $307,037 | $66,125 | $240,912 |
| 2024 | $2,579 | $203,245 | $57,500 | $145,745 |
| 2023 | $1,952 | $203,245 | $57,500 | $145,745 |
| 2022 | $1,228 | $203,245 | $57,500 | $145,745 |
| 2021 | $1,216 | $203,245 | $57,500 | $145,745 |
| 2020 | $1,751 | $193,873 | $42,800 | $151,073 |
| 2019 | $2,324 | $193,873 | $42,800 | $151,073 |
| 2018 | $2,223 | $193,873 | $42,800 | $151,073 |
| 2017 | $2,223 | $193,873 | $42,800 | $151,073 |
| 2016 | $2,103 | $181,631 | $40,000 | $141,631 |
| 2015 | $2,082 | $181,631 | $40,000 | $141,631 |
| 2014 | $2,082 | $181,631 | $40,000 | $141,631 |
| 2013 | -- | $183,647 | $40,000 | $143,647 |
Source: Public Records
Map
Nearby Homes
- 26 Danbury Ct
- 73 Freeman Dr
- 7839 U S Highway 64
- 7837 U S Highway 64
- 7841 U S Highway 64
- 115 Circle City Way
- 57 Merriville Rd
- 1157 Hillsboro St
- 114 Tantara Bend
- 80 Tantara Bend
- 328 Aspen Ave
- 76 Tantara Bend
- 250 Aspen Ave
- 64 Tantara Bend
- 338 Aspen Ave
- 108 Tantara Bend
- 91 Imagine Way
- 431 Fieldstone Ln
- 405 Fieldstone Ln
- CHANLEY Plan at Corbett Landing
- 551 Millbrook Dr
- 561 Millbrook Dr
- 565 Millbrook Dr
- 549 Millbrook Dr
- 569 Millbrook Dr
- 541 Millbrook Dr
- 573 Millbrook Dr
- 537 Millbrook Dr
- 527 Millbrook Dr
- 577 Millbrook Dr
- 583 Millbrook Dr
- 491 Millbrook Dr
- 587 Millbrook Dr
- 483 Millbrook Dr
- 475 Millbrook Dr
- 595 Millbrook Dr
- 467 Millbrook Dr
- 145 Retreat Dr
- 145 Retreat Dr
- 599 Millbrook Dr