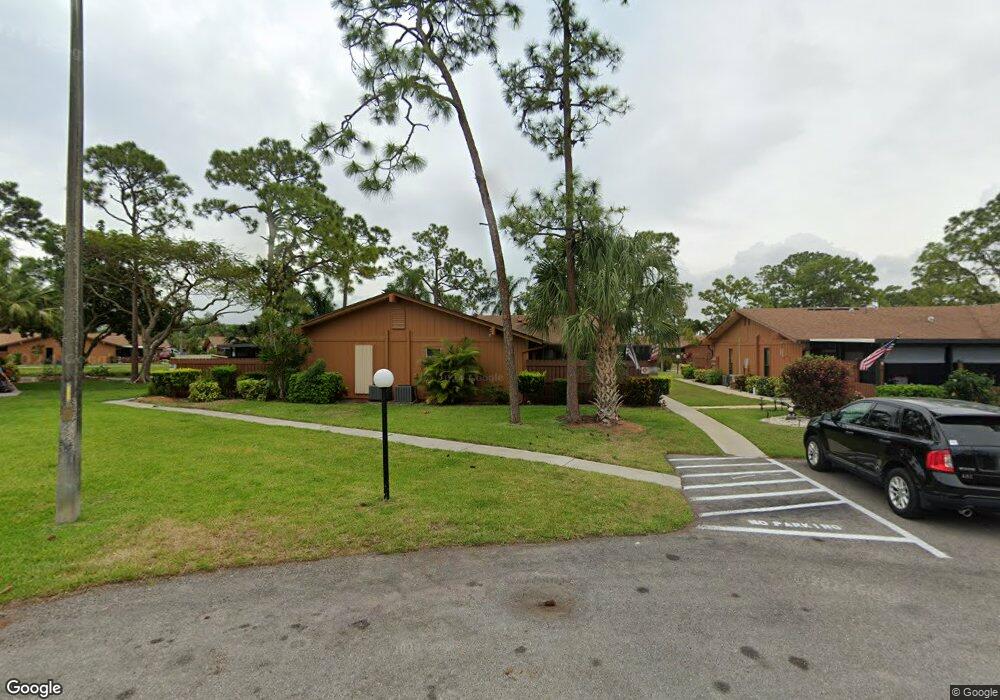
5595 Foxlake Dr North Fort Myers, FL 33917
Estimated Value: $200,000 - $216,000
2
Beds
2
Baths
1,020
Sq Ft
$202/Sq Ft
Est. Value
About This Home
This home is located at 5595 Foxlake Dr, North Fort Myers, FL 33917 and is currently estimated at $206,073, approximately $202 per square foot. 5595 Foxlake Dr is a home located in Lee County with nearby schools including J. Colin English Elementary School, Dr. Carrie D. Robinson Littleton Elementary School, and Tropic Isles Elementary School.
Ownership History
Date
Name
Owned For
Owner Type
Purchase Details
Closed on
May 14, 2021
Sold by
Brown Jerry M and Brown Tracy E
Bought by
Figueroa Elier Barreiro and Santana Antonio L
Current Estimated Value
Home Financials for this Owner
Home Financials are based on the most recent Mortgage that was taken out on this home.
Original Mortgage
$142,887
Outstanding Balance
$129,491
Interest Rate
3.1%
Mortgage Type
FHA
Estimated Equity
$76,582
Purchase Details
Closed on
Nov 12, 2016
Sold by
Brown Geyle A
Bought by
Brown Jerry M and Brown Tracy E
Purchase Details
Closed on
Feb 26, 2015
Sold by
Savini Robert and Savini Michael
Bought by
Brown Jerry M and Brown Tracy E
Purchase Details
Closed on
Aug 3, 2012
Sold by
Defouw Eleanor M and Defouw Living Trust
Bought by
Miller Gail A
Purchase Details
Closed on
Dec 30, 1997
Sold by
Vaci Gina and Savini David
Bought by
Savini Robert J and Savini Michael E
Create a Home Valuation Report for This Property
The Home Valuation Report is an in-depth analysis detailing your home's value as well as a comparison with similar homes in the area
Home Values in the Area
Average Home Value in this Area
Purchase History
| Date | Buyer | Sale Price | Title Company |
|---|---|---|---|
| Figueroa Elier Barreiro | $151,000 | Fidelity Natl Ttl Of Fl Inc | |
| Brown Jerry M | -- | None Available | |
| Brown Jerry M | -- | Attorney | |
| Miller Gail A | $46,000 | Realty Title Solutions Lllp | |
| Savini Robert J | $15,000 | -- |
Source: Public Records
Mortgage History
| Date | Status | Borrower | Loan Amount |
|---|---|---|---|
| Open | Figueroa Elier Barreiro | $142,887 |
Source: Public Records
Tax History Compared to Growth
Tax History
| Year | Tax Paid | Tax Assessment Tax Assessment Total Assessment is a certain percentage of the fair market value that is determined by local assessors to be the total taxable value of land and additions on the property. | Land | Improvement |
|---|---|---|---|---|
| 2025 | $1,456 | $126,774 | $41,990 | $83,336 |
| 2024 | $1,456 | $140,679 | -- | -- |
| 2023 | $1,416 | $136,582 | $0 | $0 |
| 2022 | $1,560 | $132,604 | $67,052 | $65,552 |
| 2021 | $1,459 | $94,972 | $30,804 | $64,168 |
| 2020 | $1,400 | $88,826 | $30,000 | $58,826 |
| 2019 | $1,317 | $83,175 | $17,000 | $66,175 |
| 2018 | $1,242 | $79,134 | $17,000 | $62,134 |
| 2017 | $1,143 | $69,446 | $14,000 | $55,446 |
| 2016 | $989 | $62,117 | $14,723 | $47,394 |
| 2015 | $856 | $52,399 | $7,753 | $44,646 |
| 2014 | -- | $51,700 | $7,747 | $43,953 |
| 2013 | -- | $48,200 | $6,827 | $41,373 |
Source: Public Records
Map
Nearby Homes
- 5620 Foxlake Dr
- 5597 Foxlake Dr
- 5647 Foxlake Dr
- 7086 Nantucket Cir Unit 6
- 15437 Crystal Lake Dr
- 5560 Longleaf Dr
- 15451 Crystal Lake Dr
- 7055 New Post Dr Unit 6
- 7055 New Post Dr Unit 5
- 7068 Nantucket Cir Unit 7
- 7068 Nantucket Cir Unit 3
- 7074 Nantucket Cir Unit 8
- 7043 New Post Dr Unit 7
- 5716 Foxlake Dr Unit 1
- 7049 New Post Dr Unit 7
- 5705 Foxlake Dr Unit 2
- 5705 Foxlake Dr Unit 1
- 5705 Foxlake Dr Unit 11
- 5705 Foxlake Dr Unit 9
- 5705 Foxlake Dr Unit 4
- 5601 Foxlake Dr
- 5634 Foxlake Dr
- 5640 Foxlake Dr
- 5636 Foxlake Dr
- 5605 Foxlake Dr
- 5614 Foxlake Dr
- 5616 Foxlake Dr Unit D
- 5612 Foxlake Dr
- 5610 Foxlake Dr
- 5607 Foxlake Dr Unit 16D
- 5607 Foxlake Dr Unit D
- 5628 Foxlake Dr
- 5632 Foxlake Dr
- 5626 Foxlake Dr
- 5654 Foxlake Dr Unit 7C
- 5650 Foxlake Dr Unit A
- 5656 Foxlake Dr
- 5652 Foxlake Dr
- 5660 Foxlake Dr