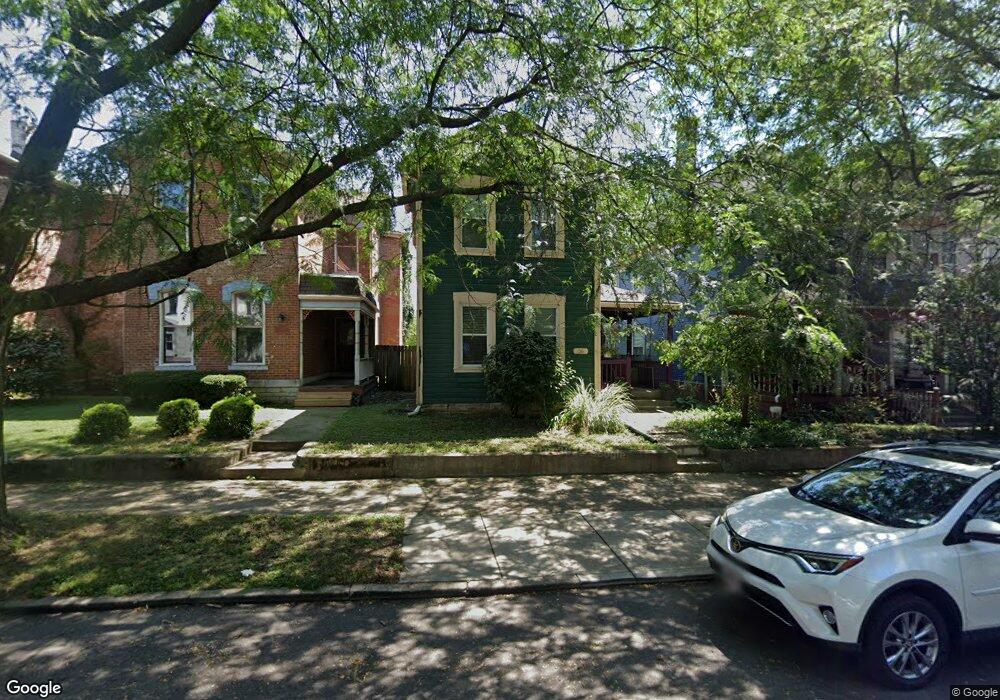
56 Huffman Ave Dayton, OH 45403
Historic Inner East NeighborhoodEstimated Value: $118,781 - $202,000
3
Beds
2
Baths
1,539
Sq Ft
$105/Sq Ft
Est. Value
About This Home
This home is located at 56 Huffman Ave, Dayton, OH 45403 and is currently estimated at $160,945, approximately $104 per square foot. 56 Huffman Ave is a home located in Montgomery County with nearby schools including Ruskin Elementary School and Kiser Elementary.
Ownership History
Date
Name
Owned For
Owner Type
Purchase Details
Closed on
Oct 29, 2002
Sold by
Frabotta Richelle Renee
Bought by
Paxton Stephanie K
Current Estimated Value
Home Financials for this Owner
Home Financials are based on the most recent Mortgage that was taken out on this home.
Original Mortgage
$73,600
Outstanding Balance
$30,964
Interest Rate
6.08%
Estimated Equity
$129,981
Purchase Details
Closed on
Aug 24, 1995
Sold by
Paxton Stephanie K
Bought by
Paxton Stephanie K and Frabotta Richelle Renee
Purchase Details
Closed on
Jun 26, 1995
Sold by
Paxton Stephanie K and Frabotta Richelle Renee
Bought by
Paxton Stephanie K
Purchase Details
Closed on
Mar 14, 1995
Sold by
Paxton Stephanie K
Bought by
Paxton Stephanie K and Frabotta Richelle Renee
Purchase Details
Closed on
Feb 24, 1995
Sold by
Adinehsadeh Javad and Adinehsadeh Fakhrinne
Bought by
Paxton Stephanie K
Purchase Details
Closed on
May 9, 1994
Sold by
Rapelye Eugene and Rapelye Ersa Lea
Bought by
Adinehzadeh Javad
Create a Home Valuation Report for This Property
The Home Valuation Report is an in-depth analysis detailing your home's value as well as a comparison with similar homes in the area
Home Values in the Area
Average Home Value in this Area
Purchase History
| Date | Buyer | Sale Price | Title Company |
|---|---|---|---|
| Paxton Stephanie K | -- | -- | |
| Paxton Stephanie K | -- | -- | |
| Paxton Stephanie K | -- | -- | |
| Paxton Stephanie K | -- | -- | |
| Paxton Stephanie K | -- | -- | |
| Adinehzadeh Javad | -- | -- |
Source: Public Records
Mortgage History
| Date | Status | Borrower | Loan Amount |
|---|---|---|---|
| Open | Paxton Stephanie K | $73,600 |
Source: Public Records
Tax History Compared to Growth
Tax History
| Year | Tax Paid | Tax Assessment Tax Assessment Total Assessment is a certain percentage of the fair market value that is determined by local assessors to be the total taxable value of land and additions on the property. | Land | Improvement |
|---|---|---|---|---|
| 2024 | $1,309 | $23,170 | $4,520 | $18,650 |
| 2023 | $1,309 | $23,170 | $4,520 | $18,650 |
| 2022 | $1,668 | $22,680 | $4,430 | $18,250 |
| 2021 | $1,659 | $22,680 | $4,430 | $18,250 |
| 2020 | $1,656 | $22,680 | $4,430 | $18,250 |
| 2019 | $1,331 | $16,240 | $4,430 | $11,810 |
| 2018 | $1,333 | $16,240 | $4,430 | $11,810 |
| 2017 | $1,322 | $16,240 | $4,430 | $11,810 |
| 2016 | $1,445 | $16,950 | $4,430 | $12,520 |
| 2015 | $1,465 | $16,950 | $4,430 | $12,520 |
| 2014 | $1,465 | $16,950 | $4,430 | $12,520 |
| 2012 | -- | $20,410 | $5,860 | $14,550 |
Source: Public Records
Map
Nearby Homes
- 78 Huffman Ave Unit 76
- 1820 E 4th St
- 35 Huffman Ave
- 1802 E 3rd St
- 0 Huffman Ave
- 1716 E 4th St
- 21 Boltin St Unit 19
- 44 Bell St
- 28 Boltin St
- 44 Springfield St
- 60 Bell St
- 26 Boltin St Unit 26-28
- 140 S Terry St
- 41 Boltin St
- 71 Mcreynolds St
- 150 Stainton Ave
- 108 Samuel St
- 1609 E 5th St
- 2126 E 4th St
- 241 Linden Ave