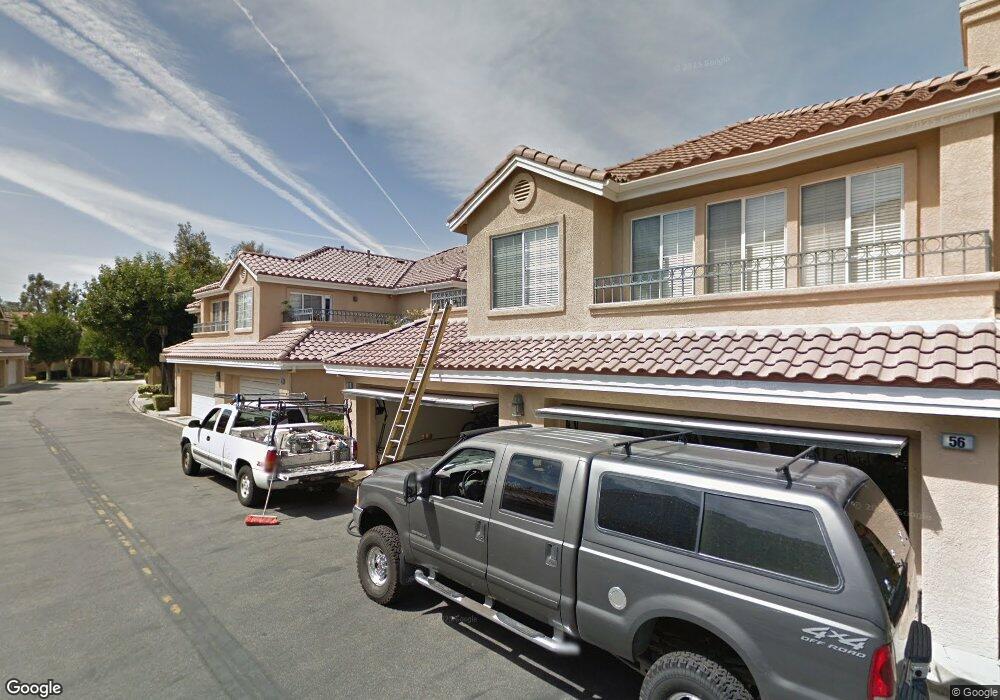
56 Morning Glory Unit 76 Rancho Santa Margarita, CA 92688
Estimated Value: $673,444 - $732,000
2
Beds
2
Baths
1,080
Sq Ft
$657/Sq Ft
Est. Value
About This Home
This home is located at 56 Morning Glory Unit 76, Rancho Santa Margarita, CA 92688 and is currently estimated at $709,861, approximately $657 per square foot. 56 Morning Glory Unit 76 is a home located in Orange County with nearby schools including Cielo Vista Elementary School, Rancho Santa Margarita Intermediate School, and Trabuco Hills High School.
Ownership History
Date
Name
Owned For
Owner Type
Purchase Details
Closed on
Mar 4, 2002
Sold by
Lafond Raphael J and Lafond Christine L
Bought by
Jordan Christopher J
Current Estimated Value
Home Financials for this Owner
Home Financials are based on the most recent Mortgage that was taken out on this home.
Original Mortgage
$187,600
Outstanding Balance
$134,040
Interest Rate
6.62%
Estimated Equity
$575,821
Purchase Details
Closed on
Aug 7, 1997
Sold by
Federal National Mortgage Association
Bought by
Lafond Raphael J and Marquez Christine L
Home Financials for this Owner
Home Financials are based on the most recent Mortgage that was taken out on this home.
Original Mortgage
$121,150
Interest Rate
7.43%
Mortgage Type
Seller Take Back
Purchase Details
Closed on
May 9, 1997
Sold by
Tracy Howell and Tracy Richard S
Bought by
Federal National Mortgage Association
Purchase Details
Closed on
Aug 4, 1995
Sold by
Howell Richard S
Bought by
Howell Tracy P
Create a Home Valuation Report for This Property
The Home Valuation Report is an in-depth analysis detailing your home's value as well as a comparison with similar homes in the area
Home Values in the Area
Average Home Value in this Area
Purchase History
| Date | Buyer | Sale Price | Title Company |
|---|---|---|---|
| Jordan Christopher J | $234,500 | Fidelity National Title | |
| Lafond Raphael J | $125,000 | Chicago Title Co | |
| Federal National Mortgage Association | $113,000 | First Southwestern Title Co | |
| Howell Tracy P | -- | -- |
Source: Public Records
Mortgage History
| Date | Status | Borrower | Loan Amount |
|---|---|---|---|
| Open | Jordan Christopher J | $187,600 | |
| Previous Owner | Lafond Raphael J | $121,150 | |
| Closed | Jordan Christopher J | $35,150 |
Source: Public Records
Tax History Compared to Growth
Tax History
| Year | Tax Paid | Tax Assessment Tax Assessment Total Assessment is a certain percentage of the fair market value that is determined by local assessors to be the total taxable value of land and additions on the property. | Land | Improvement |
|---|---|---|---|---|
| 2025 | $3,475 | $346,415 | $192,845 | $153,570 |
| 2024 | $3,475 | $339,623 | $189,064 | $150,559 |
| 2023 | $3,394 | $332,964 | $185,357 | $147,607 |
| 2022 | $3,335 | $326,436 | $181,723 | $144,713 |
| 2021 | $2,803 | $320,036 | $178,160 | $141,876 |
| 2020 | $3,244 | $316,755 | $176,333 | $140,422 |
| 2019 | $3,535 | $310,545 | $172,876 | $137,669 |
| 2018 | $3,480 | $304,456 | $169,486 | $134,970 |
| 2017 | $3,504 | $298,487 | $166,163 | $132,324 |
| 2016 | $3,766 | $292,635 | $162,905 | $129,730 |
| 2015 | $3,862 | $288,240 | $160,458 | $127,782 |
| 2014 | $3,788 | $282,594 | $157,315 | $125,279 |
Source: Public Records
Map
Nearby Homes
- 4 Raposa
- 1 El Canto
- 12 Paseo Vecino
- 4 Pica Flor Unit 54
- 31 Gaviota Unit 136
- 16 Las Piedras
- 73 Gaviota
- 54 Gavilan
- 70 Gavilan Unit 18
- 25 Dewberry
- 15 Temecula Ct
- 87 Calle de Felicidad
- 29 Via Pamplona Unit 78
- 20 Via Meseta
- 7 Via Cresta Unit 117
- 9 Via Cresta
- 45 Via Prado
- 71 Via Cresta
- 98 Via Barcelona
- 3 Calle de Los Ninos
- 156 Morning Glory
- 58 Morning Glory
- 54 Morning Glory
- 60 Morning Glory
- 158 Morning Glory
- 7 Morning Glory Unit 8
- 2 Morning Glory
- 64 Morning Glory
- 66 Morning Glory
- 68 Morning Glory
- 59 Morning Glory
- 55 Morning Glory
- 43 Morning Glory
- 25 Morning Glory Unit 23
- 70 Morning Glory
- 61 Morning Glory
- 53 Morning Glory
- 63 Morning Glory
- 160 Morning Glory Unit 80
- 22 Morning Glory Unit 15