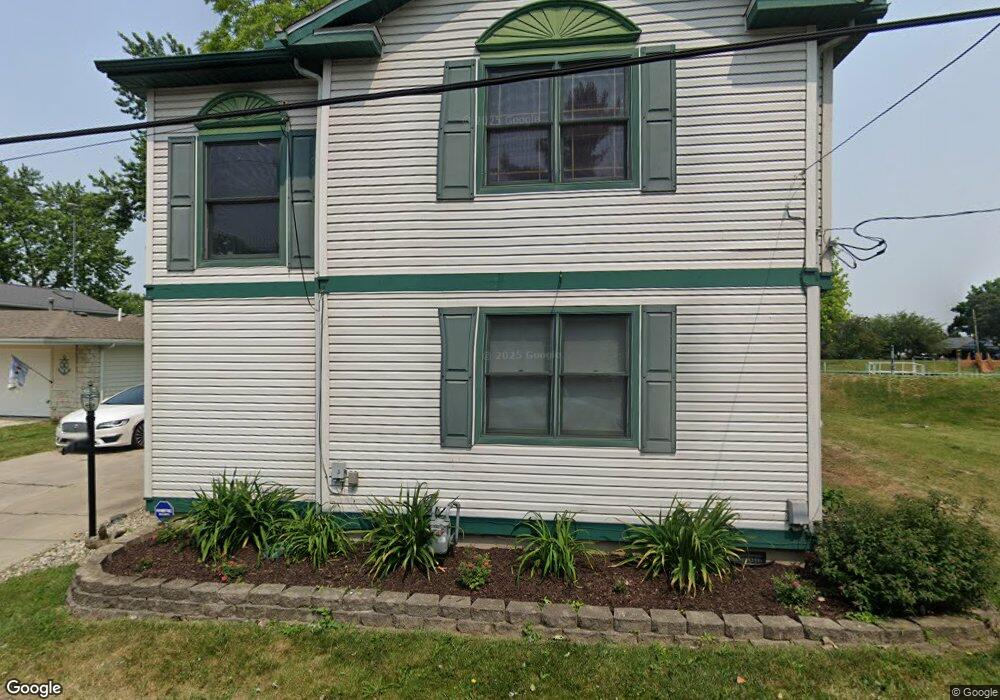
5602 310th St Toledo, OH 43611
Point Place NeighborhoodEstimated Value: $220,000 - $272,000
2
Beds
1
Bath
1,923
Sq Ft
$124/Sq Ft
Est. Value
About This Home
This home is located at 5602 310th St, Toledo, OH 43611 and is currently estimated at $239,013, approximately $124 per square foot. 5602 310th St is a home located in Lucas County with nearby schools including Edgewater Elementary School and Woodward High School.
Ownership History
Date
Name
Owned For
Owner Type
Purchase Details
Closed on
Oct 14, 2016
Sold by
Wietecki Cindy L
Bought by
Freshour Craig
Current Estimated Value
Home Financials for this Owner
Home Financials are based on the most recent Mortgage that was taken out on this home.
Original Mortgage
$148,200
Outstanding Balance
$118,810
Interest Rate
3.46%
Mortgage Type
Future Advance Clause Open End Mortgage
Estimated Equity
$120,203
Purchase Details
Closed on
Sep 26, 1990
Sold by
Wietecki Chester D
Create a Home Valuation Report for This Property
The Home Valuation Report is an in-depth analysis detailing your home's value as well as a comparison with similar homes in the area
Home Values in the Area
Average Home Value in this Area
Purchase History
| Date | Buyer | Sale Price | Title Company |
|---|---|---|---|
| Freshour Craig | $156,000 | None Available | |
| -- | -- | -- |
Source: Public Records
Mortgage History
| Date | Status | Borrower | Loan Amount |
|---|---|---|---|
| Open | Freshour Craig | $148,200 |
Source: Public Records
Tax History Compared to Growth
Tax History
| Year | Tax Paid | Tax Assessment Tax Assessment Total Assessment is a certain percentage of the fair market value that is determined by local assessors to be the total taxable value of land and additions on the property. | Land | Improvement |
|---|---|---|---|---|
| 2024 | $1,792 | $59,535 | $13,090 | $46,445 |
| 2023 | $3,281 | $52,185 | $11,340 | $40,845 |
| 2022 | $3,271 | $52,185 | $11,340 | $40,845 |
| 2021 | $3,455 | $52,185 | $11,340 | $40,845 |
| 2020 | $3,248 | $43,330 | $9,415 | $33,915 |
| 2019 | $3,160 | $43,330 | $9,415 | $33,915 |
| 2018 | $3,164 | $43,330 | $9,415 | $33,915 |
| 2017 | $3,003 | $39,130 | $8,645 | $30,485 |
| 2016 | $2,923 | $111,800 | $24,700 | $87,100 |
| 2015 | $3,115 | $111,800 | $24,700 | $87,100 |
| 2014 | $2,461 | $39,140 | $8,650 | $30,490 |
| 2013 | $2,461 | $39,140 | $8,650 | $30,490 |
Source: Public Records
Map
Nearby Homes