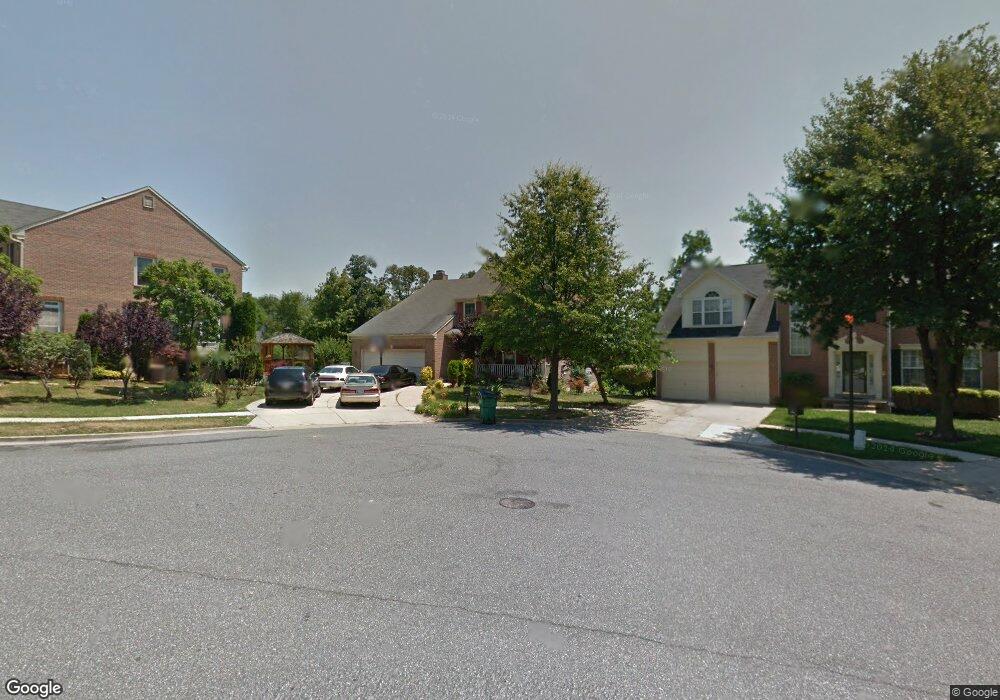
5603 Signet Ln Riverdale, MD 20737
Estimated Value: $513,000 - $711,403
--
Bed
3
Baths
2,688
Sq Ft
$227/Sq Ft
Est. Value
About This Home
This home is located at 5603 Signet Ln, Riverdale, MD 20737 and is currently estimated at $610,851, approximately $227 per square foot. 5603 Signet Ln is a home located in Prince George's County with nearby schools including Berwyn Heights Elementary School, William Wirt Middle School, and Parkdale High School.
Ownership History
Date
Name
Owned For
Owner Type
Purchase Details
Closed on
Oct 11, 2005
Sold by
Yson Caesar
Bought by
Caesa
Current Estimated Value
Purchase Details
Closed on
Apr 19, 2005
Sold by
Yson Caesar
Bought by
Caesa
Purchase Details
Closed on
Aug 6, 2001
Sold by
Minor Veronica R
Bought by
Caesar and Dyson Jocelyn
Purchase Details
Closed on
Apr 2, 1996
Sold by
Patriot Homes Inc
Bought by
Minor Veronica R
Purchase Details
Closed on
Sep 8, 1995
Sold by
Rose Goldberg Assocs Maryland Lp
Bought by
Patriot Homes Inc
Create a Home Valuation Report for This Property
The Home Valuation Report is an in-depth analysis detailing your home's value as well as a comparison with similar homes in the area
Home Values in the Area
Average Home Value in this Area
Purchase History
| Date | Buyer | Sale Price | Title Company |
|---|---|---|---|
| Caesa | -- | -- | |
| Caesa | -- | -- | |
| Caesar | $254,520 | -- | |
| Minor Veronica R | $257,668 | -- | |
| Patriot Homes Inc | $70,000 | -- |
Source: Public Records
Tax History Compared to Growth
Tax History
| Year | Tax Paid | Tax Assessment Tax Assessment Total Assessment is a certain percentage of the fair market value that is determined by local assessors to be the total taxable value of land and additions on the property. | Land | Improvement |
|---|---|---|---|---|
| 2025 | $12,289 | $636,233 | -- | -- |
| 2024 | $12,289 | $590,800 | $100,700 | $490,100 |
| 2023 | $11,496 | $560,767 | $0 | $0 |
| 2022 | $10,871 | $530,733 | $0 | $0 |
| 2021 | $10,188 | $500,700 | $100,300 | $400,400 |
| 2020 | $9,506 | $469,333 | $0 | $0 |
| 2019 | $8,917 | $437,967 | $0 | $0 |
| 2018 | $8,296 | $406,600 | $75,300 | $331,300 |
| 2017 | $8,118 | $369,200 | $0 | $0 |
| 2016 | -- | $331,800 | $0 | $0 |
| 2015 | $7,429 | $294,400 | $0 | $0 |
| 2014 | $7,429 | $294,400 | $0 | $0 |
Source: Public Records
Map
Nearby Homes