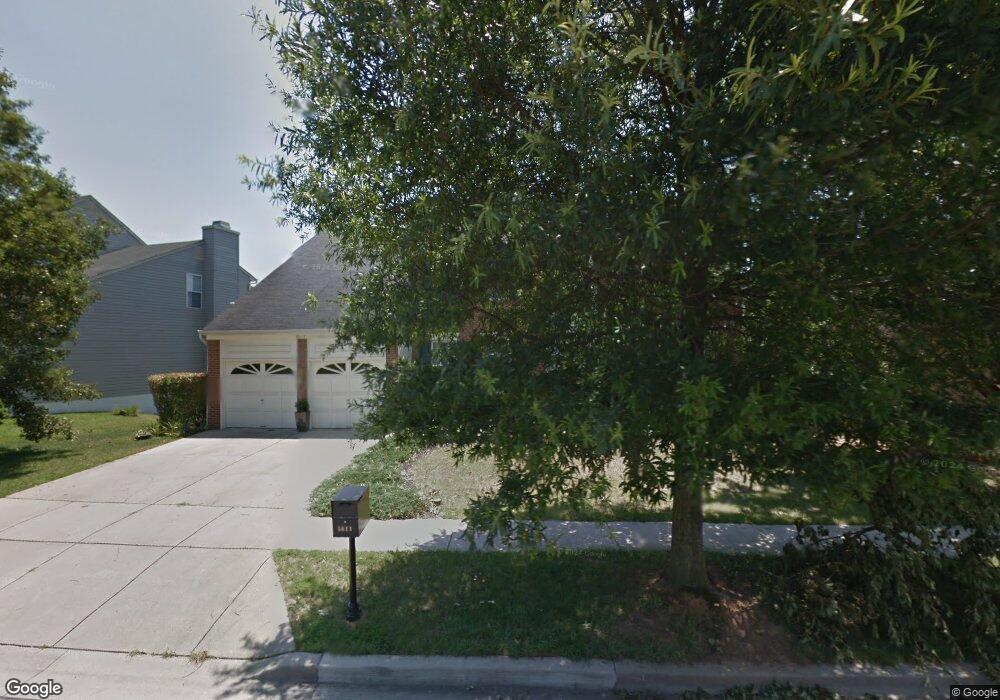
5611 Signet Ln Riverdale, MD 20737
Estimated Value: $551,000 - $666,314
--
Bed
3
Baths
2,756
Sq Ft
$231/Sq Ft
Est. Value
About This Home
This home is located at 5611 Signet Ln, Riverdale, MD 20737 and is currently estimated at $636,079, approximately $230 per square foot. 5611 Signet Ln is a home located in Prince George's County with nearby schools including Berwyn Heights Elementary School, William Wirt Middle School, and Parkdale High School.
Ownership History
Date
Name
Owned For
Owner Type
Purchase Details
Closed on
Sep 26, 2018
Sold by
Mcallister Wendell and Mcallister Vincell C
Bought by
Mcallister Wendell and Mcallister Vincell C
Current Estimated Value
Purchase Details
Closed on
Jun 13, 1995
Sold by
Maryland Homes Mh Llc
Bought by
Mcallister Wendell
Home Financials for this Owner
Home Financials are based on the most recent Mortgage that was taken out on this home.
Original Mortgage
$259,350
Interest Rate
8.21%
Create a Home Valuation Report for This Property
The Home Valuation Report is an in-depth analysis detailing your home's value as well as a comparison with similar homes in the area
Home Values in the Area
Average Home Value in this Area
Purchase History
| Date | Buyer | Sale Price | Title Company |
|---|---|---|---|
| Mcallister Wendell | -- | None Available | |
| Mcallister Wendell | $273,000 | -- |
Source: Public Records
Mortgage History
| Date | Status | Borrower | Loan Amount |
|---|---|---|---|
| Closed | Mcallister Wendell | $259,350 |
Source: Public Records
Tax History Compared to Growth
Tax History
| Year | Tax Paid | Tax Assessment Tax Assessment Total Assessment is a certain percentage of the fair market value that is determined by local assessors to be the total taxable value of land and additions on the property. | Land | Improvement |
|---|---|---|---|---|
| 2025 | $9,118 | $547,767 | -- | -- |
| 2024 | $9,118 | $511,900 | $100,700 | $411,200 |
| 2023 | $8,560 | $485,267 | $0 | $0 |
| 2022 | $8,109 | $458,633 | $0 | $0 |
| 2021 | $7,630 | $432,000 | $100,300 | $331,700 |
| 2020 | $7,343 | $411,933 | $0 | $0 |
| 2019 | $7,094 | $391,867 | $0 | $0 |
| 2018 | $6,684 | $371,800 | $75,300 | $296,500 |
| 2017 | $6,868 | $338,333 | $0 | $0 |
| 2016 | -- | $304,867 | $0 | $0 |
| 2015 | $6,489 | $271,400 | $0 | $0 |
| 2014 | $6,489 | $271,400 | $0 | $0 |
Source: Public Records
Map
Nearby Homes