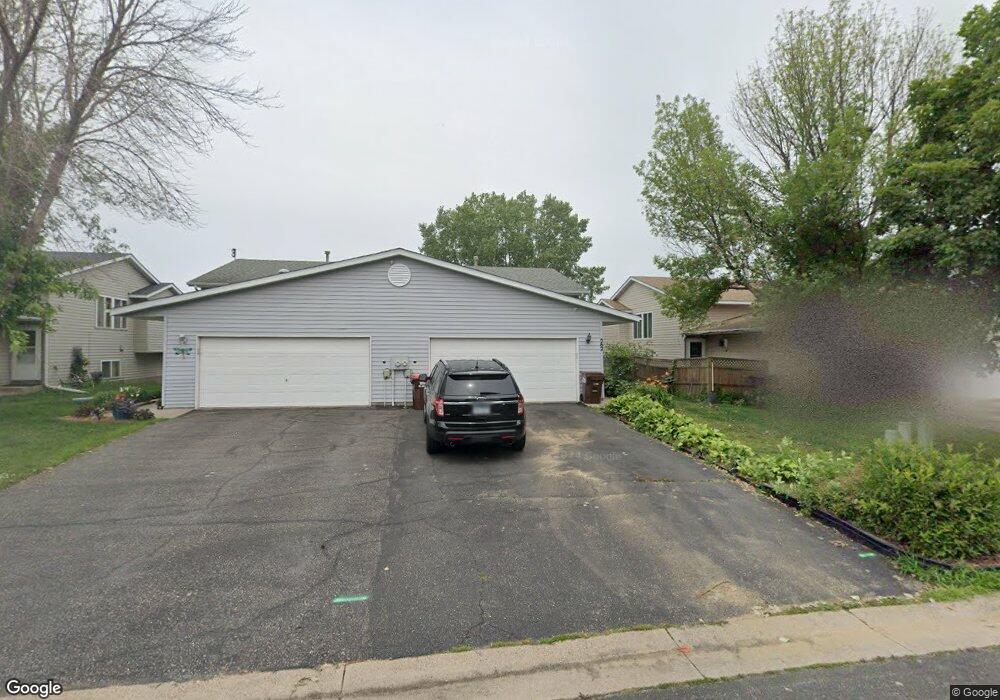
562 Kendall Dr Hastings, MN 55033
Hastings-Marshan Township NeighborhoodEstimated Value: $244,000 - $297,139
3
Beds
2
Baths
1,712
Sq Ft
$157/Sq Ft
Est. Value
About This Home
This home is located at 562 Kendall Dr, Hastings, MN 55033 and is currently estimated at $268,285, approximately $156 per square foot. 562 Kendall Dr is a home located in Dakota County with nearby schools including Kennedy Elementary School, Hastings Middle School, and Hastings High School.
Ownership History
Date
Name
Owned For
Owner Type
Purchase Details
Closed on
Oct 29, 2021
Sold by
Onsinyo Frankline M and Onsinyo Rachel A
Bought by
Benson Beth and Salgado Salvador
Current Estimated Value
Home Financials for this Owner
Home Financials are based on the most recent Mortgage that was taken out on this home.
Original Mortgage
$220,115
Outstanding Balance
$201,697
Interest Rate
2.99%
Mortgage Type
New Conventional
Estimated Equity
$66,588
Purchase Details
Closed on
May 29, 2009
Sold by
Blatz Joseph P
Bought by
Onsinyo Krankline M and Onsinyo Rachel A
Home Financials for this Owner
Home Financials are based on the most recent Mortgage that was taken out on this home.
Original Mortgage
$102,116
Interest Rate
5%
Mortgage Type
FHA
Purchase Details
Closed on
May 26, 2005
Sold by
Goff Jennifer R
Bought by
Blatz Joseph P
Purchase Details
Closed on
Jul 11, 1996
Sold by
Cir Homes Inc
Bought by
Sutton-Brown Kathie L and Sutton-Brown Steve A
Create a Home Valuation Report for This Property
The Home Valuation Report is an in-depth analysis detailing your home's value as well as a comparison with similar homes in the area
Home Values in the Area
Average Home Value in this Area
Purchase History
| Date | Buyer | Sale Price | Title Company |
|---|---|---|---|
| Benson Beth | $231,700 | Dca Title | |
| Onsinyo Krankline M | $104,000 | -- | |
| Blatz Joseph P | $169,700 | -- | |
| Sutton-Brown Kathie L | $98,240 | -- |
Source: Public Records
Mortgage History
| Date | Status | Borrower | Loan Amount |
|---|---|---|---|
| Open | Benson Beth | $220,115 | |
| Previous Owner | Onsinyo Krankline M | $102,116 |
Source: Public Records
Tax History Compared to Growth
Tax History
| Year | Tax Paid | Tax Assessment Tax Assessment Total Assessment is a certain percentage of the fair market value that is determined by local assessors to be the total taxable value of land and additions on the property. | Land | Improvement |
|---|---|---|---|---|
| 2024 | $2,730 | $251,100 | $40,200 | $210,900 |
| 2023 | $2,730 | $248,500 | $40,200 | $208,300 |
| 2022 | $2,366 | $242,400 | $40,100 | $202,300 |
| 2021 | $2,198 | $200,000 | $34,900 | $165,100 |
| 2020 | $2,210 | $185,700 | $33,200 | $152,500 |
| 2019 | $1,991 | $180,600 | $31,700 | $148,900 |
| 2018 | $2,201 | $165,200 | $30,100 | $135,100 |
| 2017 | $2,054 | $151,000 | $28,700 | $122,300 |
| 2016 | $2,097 | $140,300 | $26,800 | $113,500 |
| 2015 | $1,926 | $114,597 | $21,389 | $93,208 |
| 2014 | -- | $102,389 | $20,062 | $82,327 |
| 2013 | -- | $91,598 | $17,591 | $74,007 |
Source: Public Records
Map
Nearby Homes
- 3575 Vermillion St
- 3525 Vermillion St
- 365 Hayes Dr Unit 30
- 235 Tiffany Dr
- 182 Sandpiper Cir
- 3525 Douglas Dr
- 753 Greten Ln
- 3200 Malcolm Ave
- 782 31st St W
- 115 Kinglet Dr
- 4198 Starling Dr
- 2000 Forest St
- 1163 Teal Way
- 1942 Eddy St
- 3125 Village Trail Unit 217
- 3591 Village Way
- 2021 Pine St
- 545 Tuttle Dr
- 416 19th St W
- 2211 Glacier Way
- 560 Kendall Dr
- 566 Kendall Dr
- 558 Kendall Dr
- 540 Kendall Dr
- 568 Kendall Dr
- 536 Kendall Dr
- 570 570 Kendall Dr
- 570 Kendall Dr
- 572 Kendall Dr
- 561 Kendall Dr
- 574 Kendall Dr
- 563 Kendall Dr
- 559 Kendall Dr
- 563 563 Kendall Dr
- 557 Kendall Dr
- 565 Kendall Dr
- 567 Kendall Dr
- 551 Kendall Dr
- 528 Tiffany Dr
- 541 Kendall Dr