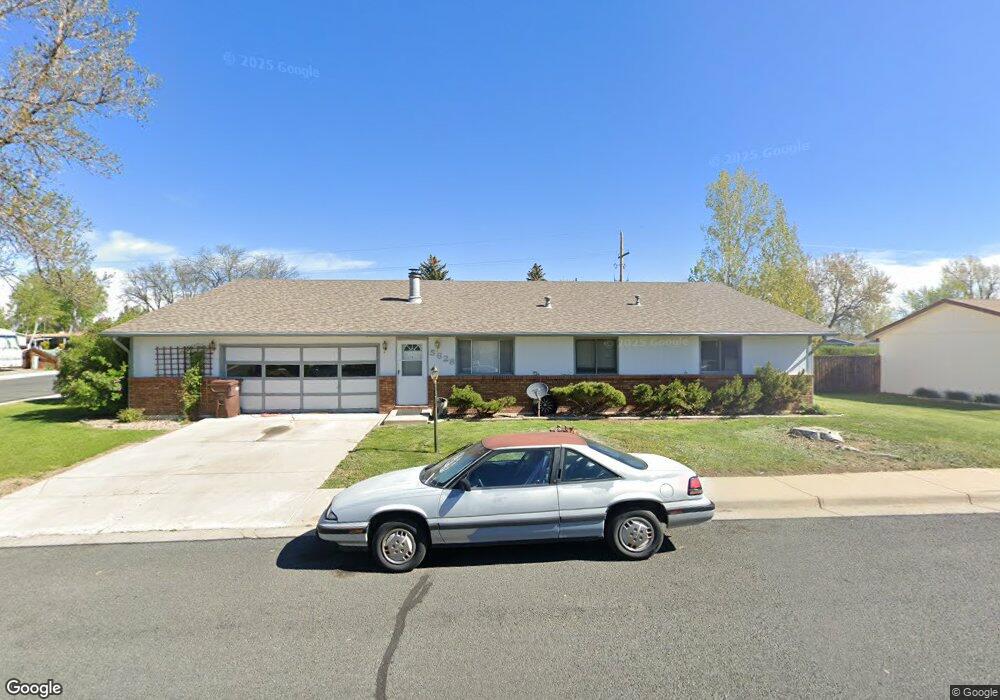
5628 Meyers Dr Loveland, CO 80538
Estimated Value: $509,000 - $577,000
3
Beds
2
Baths
2,156
Sq Ft
$252/Sq Ft
Est. Value
About This Home
This home is located at 5628 Meyers Dr, Loveland, CO 80538 and is currently estimated at $542,975, approximately $251 per square foot. 5628 Meyers Dr is a home located in Larimer County with nearby schools including Laurene Edmondson Elementary School, Lucile Erwin Middle School, and Loveland High School.
Ownership History
Date
Name
Owned For
Owner Type
Purchase Details
Closed on
Oct 13, 2004
Sold by
Jeckel Shane L
Bought by
Warnock Alvin C and Warnock Julie F
Current Estimated Value
Home Financials for this Owner
Home Financials are based on the most recent Mortgage that was taken out on this home.
Original Mortgage
$164,720
Outstanding Balance
$79,382
Interest Rate
5.37%
Mortgage Type
Unknown
Estimated Equity
$463,593
Purchase Details
Closed on
May 3, 2004
Sold by
Parker Mary
Bought by
Jeckel Shane L
Purchase Details
Closed on
Apr 30, 2002
Sold by
Parker Mary
Bought by
Parker Mary Elizabeth
Home Financials for this Owner
Home Financials are based on the most recent Mortgage that was taken out on this home.
Original Mortgage
$170,000
Interest Rate
7.11%
Purchase Details
Closed on
Feb 1, 1996
Sold by
Hergenreder Mary Elizabeth
Bought by
Parker Mary
Purchase Details
Closed on
Mar 1, 1993
Sold by
Aldrich Larry Alan
Bought by
Hergenreder Mary Elizabeth
Create a Home Valuation Report for This Property
The Home Valuation Report is an in-depth analysis detailing your home's value as well as a comparison with similar homes in the area
Home Values in the Area
Average Home Value in this Area
Purchase History
| Date | Buyer | Sale Price | Title Company |
|---|---|---|---|
| Warnock Alvin C | $205,900 | Land Title Guarantee Company | |
| Jeckel Shane L | -- | -- | |
| Parker Mary Elizabeth | -- | -- | |
| Parker Mary | -- | -- | |
| Hergenreder Mary Elizabeth | $75,000 | -- |
Source: Public Records
Mortgage History
| Date | Status | Borrower | Loan Amount |
|---|---|---|---|
| Open | Warnock Alvin C | $164,720 | |
| Previous Owner | Parker Mary Elizabeth | $170,000 |
Source: Public Records
Tax History Compared to Growth
Tax History
| Year | Tax Paid | Tax Assessment Tax Assessment Total Assessment is a certain percentage of the fair market value that is determined by local assessors to be the total taxable value of land and additions on the property. | Land | Improvement |
|---|---|---|---|---|
| 2025 | $2,685 | $36,120 | $2,881 | $33,239 |
| 2024 | $2,592 | $36,120 | $2,881 | $33,239 |
| 2022 | $2,221 | $27,641 | $2,989 | $24,652 |
| 2021 | $2,279 | $28,436 | $3,075 | $25,361 |
| 2020 | $2,070 | $25,826 | $3,075 | $22,751 |
| 2019 | $2,035 | $25,826 | $3,075 | $22,751 |
| 2018 | $2,127 | $25,632 | $3,096 | $22,536 |
| 2017 | $1,836 | $25,632 | $3,096 | $22,536 |
| 2016 | $1,947 | $26,300 | $3,423 | $22,877 |
| 2015 | $1,930 | $26,300 | $3,420 | $22,880 |
| 2014 | $1,520 | $20,040 | $3,420 | $16,620 |
Source: Public Records
Map
Nearby Homes
- 605 W 57th St Unit 42
- 605 W 57th St Unit 20
- 605 W 57th St Unit 34
- 221 W 57th St Unit A3
- 221 W 57th St Unit 87B
- 221 W 57th St Unit 89B
- 221 W 57th St Unit 58B
- 221 W 57th St Unit 24A
- 221 W 57th St Unit B67
- 221 W 57th St Unit 61A
- 221 W 57th St Unit B61
- 221 W 57th St Unit 90A
- 221 W 57th St Unit 6B
- 221 W 57th St Unit A27
- 6304 Tongass Ave
- 486 Osceola Dr
- 369 Tahoe Dr
- 6438 San Isabel Ave
- 5190 Brandywine Dr
- 5180 Brandywine Dr
- 5624 Meyers Dr
- 617 Chestnut Dr
- 5620 Meyers Dr
- 5613 Meyers Dr
- 613 Chestnut Dr
- 625 Heckle Ct
- 5616 Meyers Dr
- 616 Chestnut Dr
- 609 Chestnut Dr
- 5612 Meyers Dr
- 5608 Meyers Dr
- 612 Chestnut Dr
- 605 Chestnut Dr
- 627 Heckle Ct
- 5604 Meyers Dr
- 5521 Meyers Dr
- 608 Chestnut Dr
- 5613 Gabriel Dr
- 5617 Gabriel Dr
- 5600 Meyers Dr