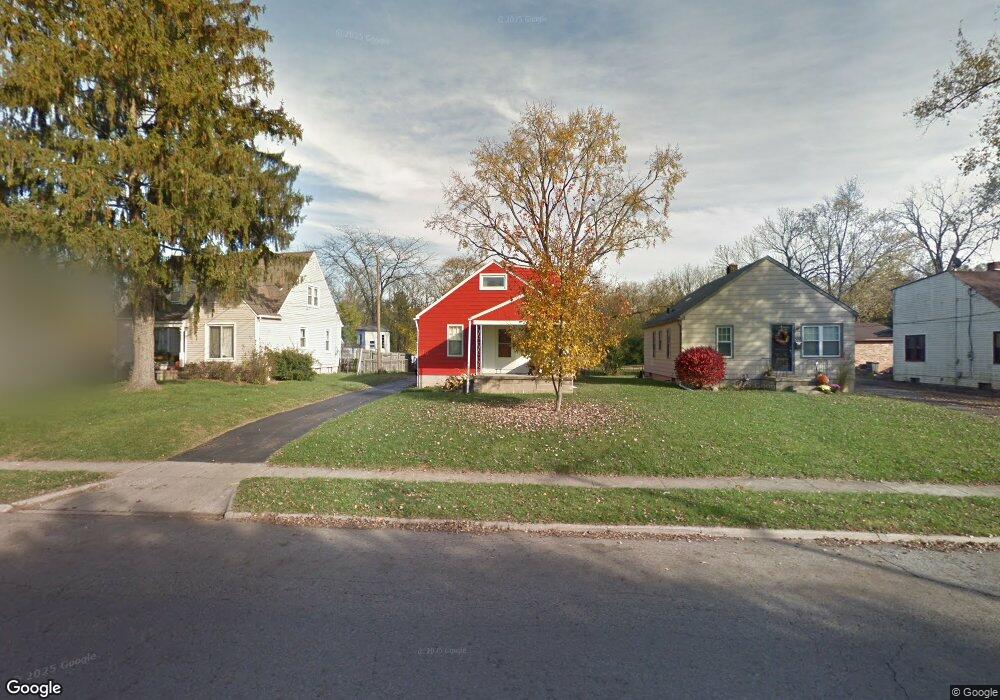
564 Collingwood Ave Columbus, OH 43213
Estimated Value: $191,000 - $206,000
3
Beds
1
Bath
1,382
Sq Ft
$144/Sq Ft
Est. Value
About This Home
This home is located at 564 Collingwood Ave, Columbus, OH 43213 and is currently estimated at $199,517, approximately $144 per square foot. 564 Collingwood Ave is a home located in Franklin County with nearby schools including Beechwood Elementary School, Etna Road Elementary School, and Rosemore Middle School.
Ownership History
Date
Name
Owned For
Owner Type
Purchase Details
Closed on
Jan 25, 2016
Bought by
Jeanette A Beasley
Current Estimated Value
Purchase Details
Closed on
May 22, 1990
Bought by
Brinkley Wilson
Create a Home Valuation Report for This Property
The Home Valuation Report is an in-depth analysis detailing your home's value as well as a comparison with similar homes in the area
Home Values in the Area
Average Home Value in this Area
Purchase History
| Date | Buyer | Sale Price | Title Company |
|---|---|---|---|
| Jeanette A Beasley | -- | -- | |
| Brinkley Wilson | -- | -- |
Source: Public Records
Tax History Compared to Growth
Tax History
| Year | Tax Paid | Tax Assessment Tax Assessment Total Assessment is a certain percentage of the fair market value that is determined by local assessors to be the total taxable value of land and additions on the property. | Land | Improvement |
|---|---|---|---|---|
| 2024 | $2,964 | $62,860 | $13,650 | $49,210 |
| 2023 | $2,795 | $62,860 | $13,650 | $49,210 |
| 2022 | $2,154 | $34,240 | $6,410 | $27,830 |
| 2021 | $1,836 | $34,240 | $6,410 | $27,830 |
| 2020 | $1,818 | $34,240 | $6,410 | $27,830 |
| 2019 | $1,659 | $27,160 | $5,110 | $22,050 |
| 2018 | $845 | $27,160 | $5,110 | $22,050 |
| 2017 | $1,602 | $27,160 | $5,110 | $22,050 |
| 2016 | $1,402 | $21,460 | $4,590 | $16,870 |
| 2015 | $419 | $21,460 | $4,590 | $16,870 |
| 2014 | $837 | $21,460 | $4,590 | $16,870 |
| 2013 | $473 | $23,835 | $5,075 | $18,760 |
Source: Public Records
Map
Nearby Homes
- 526 Collingwood Ave
- 3811 Brentwood Ct
- 647 S Napoleon Ave
- 320 Collingwood Ave
- 646 S Weyant Ave
- 733 S Napoleon Ave
- 3814 Elbern Ave
- 708 S Waverly St
- 711 S Waverly St
- 871 Ruby Ave
- 892 Ruby Ave
- 836 S Weyant Ave
- 931 E Fulton St
- 4094 E Main St
- 864 S Waverly St
- 201 S Weyant Ave
- 3598 Astor Ave
- 178 S Weyant Ave
- 891 S Weyant Ave Unit 893
- 842 S Hampton Rd
- 558 Collingwood Ave
- 570 Collingwood Ave
- 552 Collingwood Ave
- 576 Collingwood Ave
- 546 Collingwood Ave
- 578 Collingwood Ave
- 540 Collingwood Ave
- 584 Collingwood Ave
- 569 Collingwood Ave
- 590 Collingwood Ave
- 563 Collingwood Ave
- 532 Collingwood Ave
- 581 Collingwood Ave
- 557 Collingwood Ave
- 551 Collingwood Ave
- 545 Collingwood Ave
- 598 Collingwood Ave
- 585 Collingwood Ave
- 541 Collingwood Ave
- 602 Collingwood Ave Unit 604