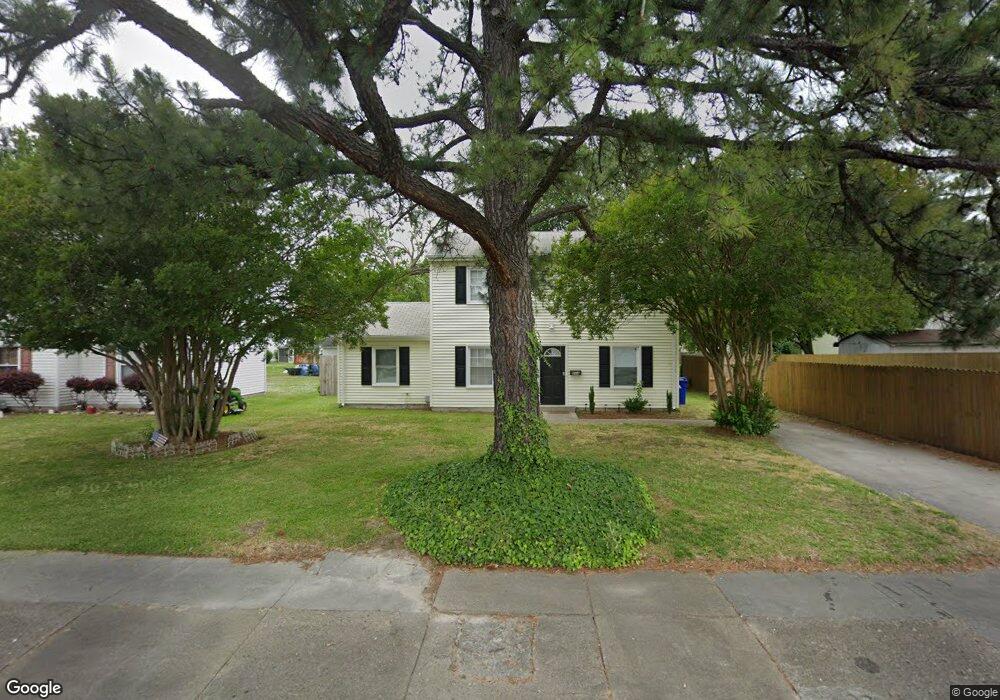
564 Portsmouth Blvd Portsmouth, VA 23704
South Portsmouth NeighborhoodEstimated Value: $213,000 - $240,000
3
Beds
2
Baths
1,220
Sq Ft
$188/Sq Ft
Est. Value
About This Home
This home is located at 564 Portsmouth Blvd, Portsmouth, VA 23704 and is currently estimated at $229,909, approximately $188 per square foot. 564 Portsmouth Blvd is a home located in Portsmouth City with nearby schools including Brighton Elementary School, Manor High School, and Court Street Academy.
Ownership History
Date
Name
Owned For
Owner Type
Purchase Details
Closed on
Sep 20, 2021
Sold by
Real Property Ventures Llc
Bought by
Burrell Samaria
Current Estimated Value
Home Financials for this Owner
Home Financials are based on the most recent Mortgage that was taken out on this home.
Original Mortgage
$204,600
Outstanding Balance
$185,764
Interest Rate
2.8%
Mortgage Type
VA
Estimated Equity
$44,145
Purchase Details
Closed on
May 6, 2021
Sold by
Maben Sharon
Bought by
Real Property Ventures Llc
Home Financials for this Owner
Home Financials are based on the most recent Mortgage that was taken out on this home.
Original Mortgage
$107,100
Interest Rate
3.1%
Mortgage Type
Amount Keyed Is An Aggregate Amount
Purchase Details
Closed on
Mar 21, 2013
Sold by
Duke Carolyn D
Bought by
Maben Sharon
Home Financials for this Owner
Home Financials are based on the most recent Mortgage that was taken out on this home.
Original Mortgage
$75,000
Interest Rate
3.58%
Mortgage Type
New Conventional
Create a Home Valuation Report for This Property
The Home Valuation Report is an in-depth analysis detailing your home's value as well as a comparison with similar homes in the area
Home Values in the Area
Average Home Value in this Area
Purchase History
| Date | Buyer | Sale Price | Title Company |
|---|---|---|---|
| Burrell Samaria | $200,000 | First American Title | |
| Real Property Ventures Llc | $70,000 | Titlquest | |
| Maben Sharon | $85,000 | -- |
Source: Public Records
Mortgage History
| Date | Status | Borrower | Loan Amount |
|---|---|---|---|
| Open | Burrell Samaria | $204,600 | |
| Previous Owner | Real Property Ventures Llc | $107,100 | |
| Previous Owner | Maben Sharon | $75,000 |
Source: Public Records
Tax History Compared to Growth
Tax History
| Year | Tax Paid | Tax Assessment Tax Assessment Total Assessment is a certain percentage of the fair market value that is determined by local assessors to be the total taxable value of land and additions on the property. | Land | Improvement |
|---|---|---|---|---|
| 2025 | $2,667 | $213,690 | $67,500 | $146,190 |
| 2024 | $2,667 | $202,900 | $67,500 | $135,400 |
| 2023 | $2,812 | $211,290 | $67,500 | $143,790 |
| 2022 | $2,601 | $200,040 | $56,250 | $143,790 |
| 2021 | $1,728 | $132,960 | $40,100 | $92,860 |
| 2020 | $1,625 | $124,990 | $38,190 | $86,800 |
| 2019 | $1,612 | $123,980 | $38,190 | $85,790 |
| 2018 | $1,612 | $123,980 | $38,190 | $85,790 |
| 2017 | $1,612 | $123,980 | $38,190 | $85,790 |
| 2016 | $1,612 | $123,980 | $38,190 | $85,790 |
| 2015 | $1,612 | $123,980 | $38,190 | $85,790 |
| 2014 | $1,575 | $123,980 | $38,190 | $85,790 |
Source: Public Records
Map
Nearby Homes
- 572 Portsmouth Blvd
- 2316 Effingham St
- 2000 Effingham St
- 2409 Peach St
- 2411 Peach St
- 2906 Chestnut St
- 2516 Peach St
- 101 Gilmerton Ave
- 1002 Wilcox Ave
- 2111 Pearl St
- 2107 Pearl St
- 1906 Lasalle Ave
- 2124 Pearl St
- 1121 Fayette St
- 1918 Prentis Ave
- 2918 Mulberry St
- 2803 Elm Ave
- 1312 Hoover St
- 1315 Jefferson St
- 2810 Elm Ave
- 568 Portsmouth Blvd
- 1112 6th St
- 1108 6th St
- 1104 6th St
- 1109 7th St
- 565 Madison St
- 569 Madison St
- 1105 7th St
- 561 Madison St
- 546 Portsmouth Blvd
- 573 Madison St
- 1119 6th St
- 1115 6th St
- 1109 6th St
- 1109 6th St
- 526 Portsmouth Blvd
- 519 Madison St
- 548 Madison St
- 548 Madison St Unit 25B
- 548 Madison St Unit 25A