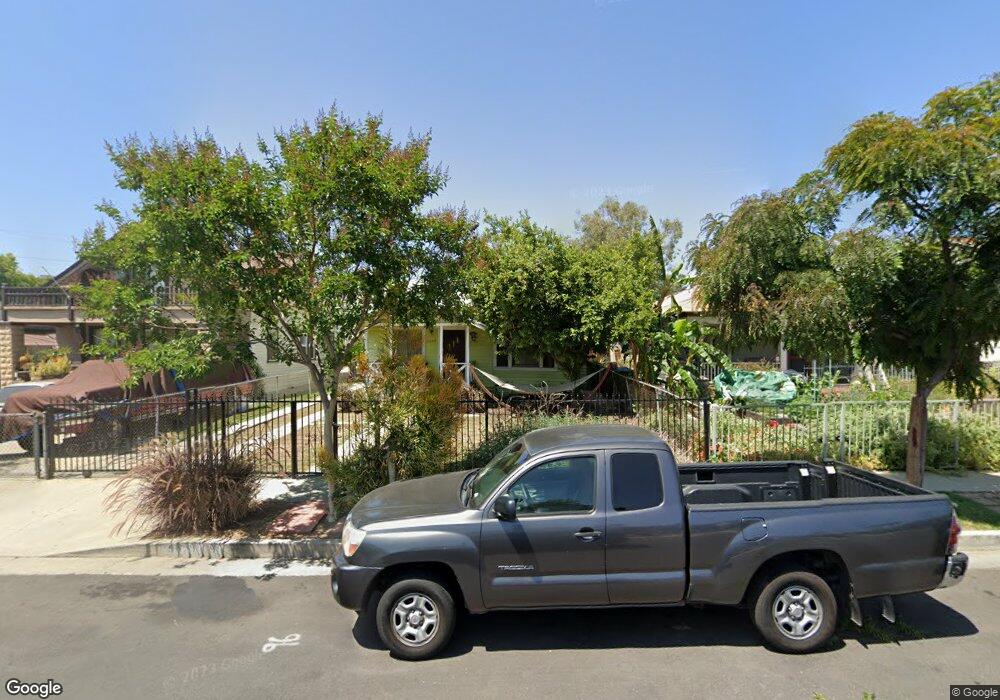
5659 Irvington Place Los Angeles, CA 90042
Estimated Value: $754,000 - $933,000
2
Beds
1
Bath
740
Sq Ft
$1,139/Sq Ft
Est. Value
About This Home
This home is located at 5659 Irvington Place, Los Angeles, CA 90042 and is currently estimated at $843,107, approximately $1,139 per square foot. 5659 Irvington Place is a home located in Los Angeles County with nearby schools including Richard Riordan Primary Center, Monte Vista Street Elementary School, and Benjamin Franklin High School.
Ownership History
Date
Name
Owned For
Owner Type
Purchase Details
Closed on
Jan 16, 2012
Sold by
Myers Robert L and Myers Blanca
Bought by
Myers Robert L and Myers Blanca
Current Estimated Value
Purchase Details
Closed on
Jan 7, 1997
Sold by
Wilmington Trust Company
Bought by
Myers Robert L
Home Financials for this Owner
Home Financials are based on the most recent Mortgage that was taken out on this home.
Original Mortgage
$104,040
Outstanding Balance
$11,286
Interest Rate
7.74%
Mortgage Type
VA
Estimated Equity
$831,821
Purchase Details
Closed on
Nov 5, 1996
Sold by
Great Western Bank Fsb
Bought by
Wilmington Trust Company and Reo Property Trust 1996
Purchase Details
Closed on
Aug 27, 1996
Sold by
Tagumasi Romeo and Tagumasi Cecilia
Bought by
Great Western Bank Fsb
Create a Home Valuation Report for This Property
The Home Valuation Report is an in-depth analysis detailing your home's value as well as a comparison with similar homes in the area
Home Values in the Area
Average Home Value in this Area
Purchase History
| Date | Buyer | Sale Price | Title Company |
|---|---|---|---|
| Myers Robert L | -- | None Available | |
| Myers Robert L | $102,000 | Chicago Title | |
| Wilmington Trust Company | -- | -- | |
| Great Western Bank Fsb | $75,454 | Chicago Title Co |
Source: Public Records
Mortgage History
| Date | Status | Borrower | Loan Amount |
|---|---|---|---|
| Open | Myers Robert L | $104,040 |
Source: Public Records
Tax History Compared to Growth
Tax History
| Year | Tax Paid | Tax Assessment Tax Assessment Total Assessment is a certain percentage of the fair market value that is determined by local assessors to be the total taxable value of land and additions on the property. | Land | Improvement |
|---|---|---|---|---|
| 2025 | $2,085 | $166,093 | $132,886 | $33,207 |
| 2024 | $2,085 | $162,837 | $130,281 | $32,556 |
| 2023 | $2,047 | $159,645 | $127,727 | $31,918 |
| 2022 | $1,953 | $156,516 | $125,223 | $31,293 |
| 2021 | $1,926 | $153,448 | $122,768 | $30,680 |
| 2019 | $1,869 | $148,899 | $119,128 | $29,771 |
| 2018 | $1,785 | $145,981 | $116,793 | $29,188 |
| 2016 | $1,697 | $140,313 | $112,258 | $28,055 |
| 2015 | $1,672 | $138,206 | $110,572 | $27,634 |
| 2014 | $1,685 | $135,500 | $108,407 | $27,093 |
Source: Public Records
Map
Nearby Homes
- 5670 Hub St
- 422 N Avenue 61
- 1480 N Avenue 57
- 1476 N Avenue 57
- 5412 Abbott Place
- Residence 2 Plan at Arroyo Ridge
- 300 S Avenue 58
- 5133 ,1/4,1/2 Baltimore St
- Residence 1 Plan at Arroyo Ridge
- 5318 Irvington Place
- 211 N Avenue 57
- 209 N Avenue 57
- 5711 Marmion Way
- 5415 Ash St
- 829 N Avenue 53
- 5830 Fayette St
- 5623 Meridian St
- 5916 Marmion Way
- 1217 N Avenue 56
- 1215 N Avenue 56
- 5653 Irvington Place
- 5663 Irvington Place
- 510 Nolden St
- 5667 Irvington Place
- 5669 Aldama St
- 5661 Aldama St
- 5660 Hub St
- 5677 Aldama St
- 5664 Hub St
- 5654 Irvington Place
- 5659 Aldama St
- 5650 Hub St
- 5656 Hub St
- 5666 Hub St
- 5644 Irvington Place
- 5685 Aldama St
- 5657 Aldama St
- 5689 Ash St
- 501 Nolden St
- 509 Nolden St