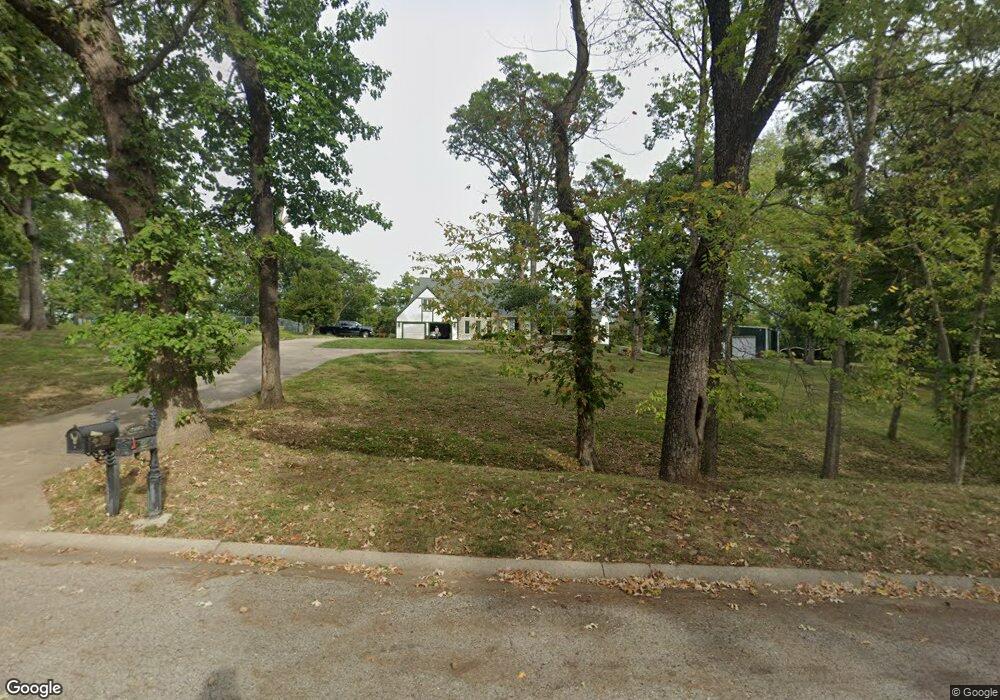
5665 Mccoy St Kansas City, MO 64133
Little Blue Valley NeighborhoodEstimated Value: $468,000 - $739,576
4
Beds
4
Baths
5,462
Sq Ft
$107/Sq Ft
Est. Value
About This Home
This home is located at 5665 Mccoy St, Kansas City, MO 64133 and is currently estimated at $583,144, approximately $106 per square foot. 5665 Mccoy St is a home located in Jackson County with nearby schools including Little Blue Elementary School, Raytown Middle School, and Raytown South High School.
Ownership History
Date
Name
Owned For
Owner Type
Purchase Details
Closed on
Jul 17, 2022
Sold by
Boles Ronnie J
Bought by
Ronnie J Boles Family Trust
Current Estimated Value
Purchase Details
Closed on
May 11, 2022
Sold by
Ruth Boles Nina
Bought by
Boles Ronnie J
Purchase Details
Closed on
Mar 23, 2004
Sold by
Shireman Frances
Bought by
Boles Ronnie J
Home Financials for this Owner
Home Financials are based on the most recent Mortgage that was taken out on this home.
Original Mortgage
$314,500
Interest Rate
6.75%
Mortgage Type
Purchase Money Mortgage
Purchase Details
Closed on
Aug 26, 2000
Sold by
Shireman Frances and Brown Frances S
Bought by
Shireman Frances
Home Financials for this Owner
Home Financials are based on the most recent Mortgage that was taken out on this home.
Original Mortgage
$259,800
Interest Rate
3.95%
Mortgage Type
Purchase Money Mortgage
Create a Home Valuation Report for This Property
The Home Valuation Report is an in-depth analysis detailing your home's value as well as a comparison with similar homes in the area
Home Values in the Area
Average Home Value in this Area
Purchase History
| Date | Buyer | Sale Price | Title Company |
|---|---|---|---|
| Ronnie J Boles Family Trust | -- | -- | |
| Boles Ronnie J | -- | None Listed On Document | |
| Boles Ronnie J | -- | Stewart Title | |
| Shireman Frances | -- | Columbian National Title |
Source: Public Records
Mortgage History
| Date | Status | Borrower | Loan Amount |
|---|---|---|---|
| Previous Owner | Boles Ronnie J | $314,500 | |
| Previous Owner | Shireman Frances | $259,800 | |
| Closed | Boles Ronnie J | $55,500 |
Source: Public Records
Tax History Compared to Growth
Tax History
| Year | Tax Paid | Tax Assessment Tax Assessment Total Assessment is a certain percentage of the fair market value that is determined by local assessors to be the total taxable value of land and additions on the property. | Land | Improvement |
|---|---|---|---|---|
| 2025 | $8,069 | $102,520 | $31,656 | $70,864 |
| 2024 | $8,069 | $89,148 | $46,290 | $42,858 |
| 2023 | $8,017 | $89,148 | $17,085 | $72,063 |
| 2022 | $7,252 | $77,520 | $6,840 | $70,680 |
| 2021 | $7,251 | $77,520 | $6,840 | $70,680 |
| 2020 | $6,982 | $73,751 | $6,840 | $66,911 |
| 2019 | $6,850 | $73,751 | $6,840 | $66,911 |
| 2018 | $5,871 | $63,483 | $15,473 | $48,010 |
| 2017 | $5,686 | $63,483 | $15,473 | $48,010 |
| 2016 | $5,686 | $61,892 | $8,001 | $53,891 |
| 2014 | $5,706 | $61,892 | $8,001 | $53,891 |
Source: Public Records
Map
Nearby Homes
- 13601 E 55th Terrace
- 12915 E 58th St
- 12909 E 54th Terrace
- 5224 Mccoy St
- 12505 E 58th Terrace
- 14048 E 56th St
- 5825 Noland Rd
- 5200 S Delaware Ave
- 12417 E 58th Terrace
- 6022 Norfleet Rd
- 5119 Spring Ave
- 6009 Marion Ave
- 5923 Larson Ave
- 12312 E 52nd Terrace S
- 12108 E 57th Terrace
- 12124 E 54th St
- 12005 E 57th Terrace
- 6012 Woodside Ave
- 19255 E 50 Terrace S
- 12100 E 52nd Terrace
- 13110 E 57th St
- 13111 E 57th St
- 13107 E 57th St
- 13110 E 57th Terrace
- 13100 E 57th St
- 13101 E 57th St
- 13106 E 57th Terrace
- 13014 E 57th St
- 13111 E 57th Terrace
- 5610 Mccoy St
- 13100 E 57th Terrace
- 13013 E 57th St
- 13010 E 57th St
- 5768 Mccoy St
- 5759 Bower St
- 13014 E 57th Terrace
- 13009 E 57th St
- 5774 Mccoy St
- 13006 E 57th St
- 13010 E 57th Terrace