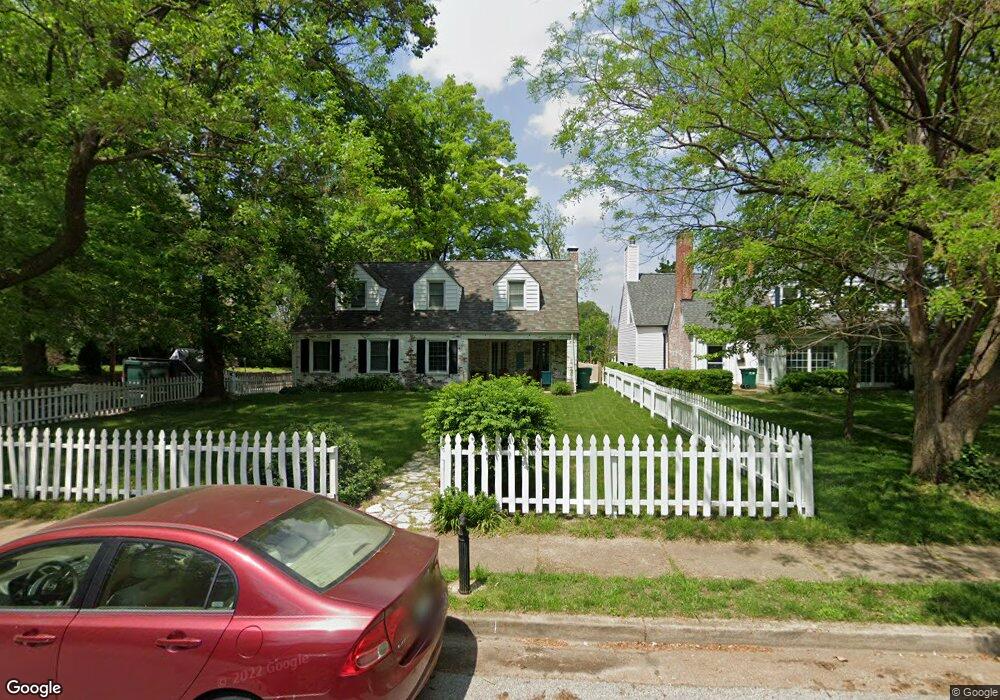
569 Olive Ct Saint Louis, MO 63119
Estimated Value: $666,912 - $816,000
4
Beds
2
Baths
2,827
Sq Ft
$268/Sq Ft
Est. Value
About This Home
This home is located at 569 Olive Ct, Saint Louis, MO 63119 and is currently estimated at $757,228, approximately $267 per square foot. 569 Olive Ct is a home located in St. Louis County with nearby schools including Clark Elementary School, Hixson Middle School, and Webster Groves High School.
Ownership History
Date
Name
Owned For
Owner Type
Purchase Details
Closed on
Nov 9, 1998
Sold by
Love Ronald L and Love Marie Patricia
Bought by
Arrandale Matthew and Arrandale Kristen
Current Estimated Value
Home Financials for this Owner
Home Financials are based on the most recent Mortgage that was taken out on this home.
Original Mortgage
$221,800
Outstanding Balance
$46,423
Interest Rate
6.12%
Mortgage Type
Assumption
Estimated Equity
$710,805
Create a Home Valuation Report for This Property
The Home Valuation Report is an in-depth analysis detailing your home's value as well as a comparison with similar homes in the area
Home Values in the Area
Average Home Value in this Area
Purchase History
| Date | Buyer | Sale Price | Title Company |
|---|---|---|---|
| Arrandale Matthew | $277,250 | -- |
Source: Public Records
Mortgage History
| Date | Status | Borrower | Loan Amount |
|---|---|---|---|
| Open | Arrandale Matthew | $221,800 |
Source: Public Records
Tax History Compared to Growth
Tax History
| Year | Tax Paid | Tax Assessment Tax Assessment Total Assessment is a certain percentage of the fair market value that is determined by local assessors to be the total taxable value of land and additions on the property. | Land | Improvement |
|---|---|---|---|---|
| 2025 | $7,073 | $118,540 | $70,110 | $48,430 |
| 2024 | $7,073 | $101,890 | $48,200 | $53,690 |
| 2023 | $7,039 | $101,890 | $48,200 | $53,690 |
| 2022 | $5,693 | $76,410 | $39,440 | $36,970 |
| 2021 | $5,673 | $76,410 | $39,440 | $36,970 |
| 2020 | $6,767 | $85,030 | $35,060 | $49,970 |
| 2019 | $6,719 | $85,030 | $35,060 | $49,970 |
| 2018 | $6,654 | $74,790 | $35,060 | $39,730 |
| 2017 | $6,609 | $74,790 | $35,060 | $39,730 |
| 2016 | $5,334 | $57,670 | $31,560 | $26,110 |
| 2015 | $5,360 | $57,670 | $31,560 | $26,110 |
| 2014 | $7,077 | $74,190 | $18,390 | $55,800 |
Source: Public Records
Map
Nearby Homes
- 904 Trellis Ln
- 127 Webster Woods Dr
- 1139 Hawken Place Unit 6
- 1353 Webster Path Dr
- 432 Reavis Place Unit 20
- 815 Sanders Dr
- 1316 Webster Forest Ct
- 514 S Gore Ave
- 200 Blackmer Place
- 340 Gray Ave
- 432 S Sappington Rd
- 144 S Rock Hill Rd
- 631 Clover Ln
- 368 S Gore Ave
- 147 Firwood Dr
- 1048 Diversey Dr
- 735 Oakway Place
- 640 Clover Ln
- 423 Parkland Ave
- 134 Firwood Dr
- 563 Olive Ct
- 623 Crofton Ave
- 559 Olive Ct
- 629 Crofton Ave
- 549 Olive Ct
- 568 Olive Ct
- 604 Crofton Ave
- 562 Olive Ct
- 558 Olive Ct
- 637 Crofton Ave
- 543 Olive Ct
- 554 Sheffield Ave
- 554 Olive Ct
- 614 Hollywood Place
- 618 Hollywood Place
- 606 Hollywood Place
- 550 Olive Ct
- 645 Crofton Ave
- 622 Hollywood Place
- 546 Sheffield Ave