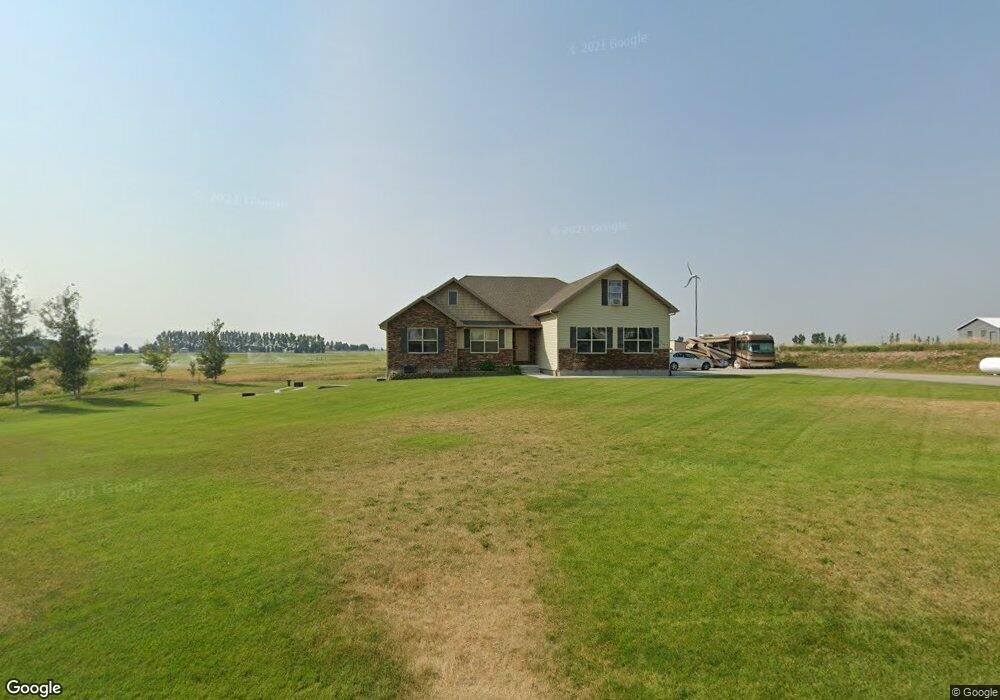
5695 W 49th S Idaho Falls, ID 83402
Estimated Value: $382,000 - $576,008
--
Bed
2
Baths
1,982
Sq Ft
$243/Sq Ft
Est. Value
About This Home
This home is located at 5695 W 49th S, Idaho Falls, ID 83402 and is currently estimated at $482,003, approximately $243 per square foot. 5695 W 49th S is a home located in Bonneville County with nearby schools including Riverview Elementary School, Sunrise Elementary School, and Donald J. Hobbs Middle School.
Ownership History
Date
Name
Owned For
Owner Type
Purchase Details
Closed on
Dec 17, 2015
Sold by
Jensen Janet
Bought by
Pickett Family Farms Llc
Current Estimated Value
Purchase Details
Closed on
Feb 13, 2014
Sold by
Pickett Evan
Bought by
Pickett Evan and Pickett Wendy
Purchase Details
Closed on
Jan 7, 2014
Sold by
Pickett Wendy and Pickett Evan
Bought by
Pickett Evan
Purchase Details
Closed on
Jan 4, 2008
Sold by
Pickett Evan D and Pickett Wendy Jo
Bought by
Pickett Evan and Pickett Wendy
Create a Home Valuation Report for This Property
The Home Valuation Report is an in-depth analysis detailing your home's value as well as a comparison with similar homes in the area
Home Values in the Area
Average Home Value in this Area
Purchase History
| Date | Buyer | Sale Price | Title Company |
|---|---|---|---|
| Pickett Family Farms Llc | -- | None Available | |
| Pickett Family Farms Llc | -- | None Available | |
| Pickett Evan | -- | None Available | |
| Pickett Evan | -- | Amerititle | |
| Pickett Evan | -- | None Available |
Source: Public Records
Tax History Compared to Growth
Tax History
| Year | Tax Paid | Tax Assessment Tax Assessment Total Assessment is a certain percentage of the fair market value that is determined by local assessors to be the total taxable value of land and additions on the property. | Land | Improvement |
|---|---|---|---|---|
| 2025 | $1,215 | $446,568 | $30,000 | $416,568 |
| 2024 | $1,215 | $410,460 | $7,500 | $402,960 |
| 2023 | $1,275 | $405,478 | $33,708 | $371,770 |
| 2022 | $1,682 | $363,412 | $33,132 | $330,280 |
| 2021 | $1,246 | $257,484 | $32,644 | $224,840 |
| 2019 | $1,238 | $235,060 | $31,940 | $203,120 |
| 2018 | $1,157 | $237,306 | $32,076 | $205,230 |
| 2017 | $1,064 | $214,968 | $28,228 | $186,740 |
| 2016 | $1,010 | $207,352 | $25,172 | $182,180 |
| 2015 | $1,062 | $193,736 | $25,244 | $168,492 |
| 2014 | $16,732 | $193,736 | $25,276 | $168,460 |
| 2013 | $1,191 | $198,044 | $25,484 | $172,560 |
Source: Public Records
Map
Nearby Homes