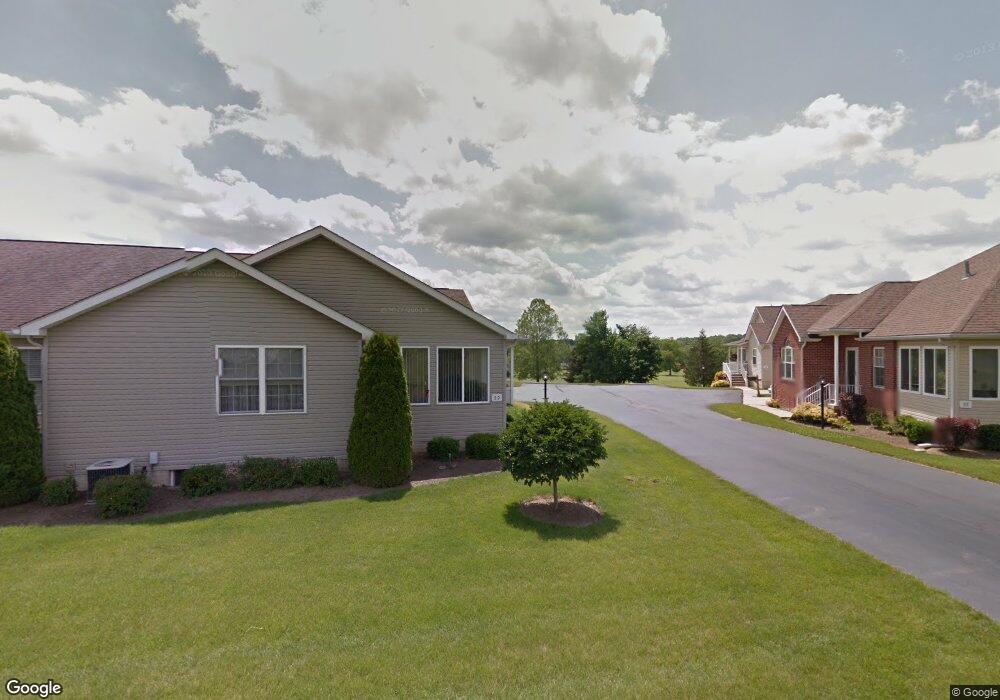
57 Fairway Dr Mount Vernon, OH 43050
Estimated Value: $257,000 - $278,000
2
Beds
2
Baths
1,491
Sq Ft
$179/Sq Ft
Est. Value
About This Home
This home is located at 57 Fairway Dr, Mount Vernon, OH 43050 and is currently estimated at $266,748, approximately $178 per square foot. 57 Fairway Dr is a home located in Knox County with nearby schools including Mount Vernon High School, St. Vincent de Paul School, and Christian Star Academy.
Ownership History
Date
Name
Owned For
Owner Type
Purchase Details
Closed on
Jun 13, 2025
Sold by
Marechal Timothy and White Barb
Bought by
White Robert Winslow and White Charlotte Ann
Current Estimated Value
Purchase Details
Closed on
Jul 19, 2019
Sold by
Marchal Dorothy G
Bought by
Marchal Eugene
Purchase Details
Closed on
Aug 25, 2003
Sold by
Marchal Eugene
Bought by
Marchal Eugene and Marchal Dorot
Purchase Details
Closed on
Mar 21, 2002
Bought by
Marchal Eugene
Purchase Details
Closed on
Oct 29, 2001
Bought by
Fairways Of Mount Vernon
Create a Home Valuation Report for This Property
The Home Valuation Report is an in-depth analysis detailing your home's value as well as a comparison with similar homes in the area
Home Values in the Area
Average Home Value in this Area
Purchase History
| Date | Buyer | Sale Price | Title Company |
|---|---|---|---|
| White Robert Winslow | $329,000 | None Listed On Document | |
| Marchal Eugene | -- | -- | |
| Marchal Eugene | -- | -- | |
| Marchal Eugene | $159,900 | -- | |
| Fairways Of Mount Vernon | -- | -- |
Source: Public Records
Tax History Compared to Growth
Tax History
| Year | Tax Paid | Tax Assessment Tax Assessment Total Assessment is a certain percentage of the fair market value that is determined by local assessors to be the total taxable value of land and additions on the property. | Land | Improvement |
|---|---|---|---|---|
| 2024 | $2,690 | $79,550 | $6,240 | $73,310 |
| 2023 | $2,690 | $79,550 | $6,240 | $73,310 |
| 2022 | $2,108 | $58,490 | $4,590 | $53,900 |
| 2021 | $2,108 | $58,490 | $4,590 | $53,900 |
| 2020 | $2,053 | $58,490 | $4,590 | $53,900 |
| 2019 | $1,856 | $50,640 | $2,570 | $48,070 |
| 2018 | $1,856 | $50,640 | $2,570 | $48,070 |
| 2017 | $1,823 | $50,640 | $2,570 | $48,070 |
| 2016 | $1,663 | $46,890 | $2,380 | $44,510 |
| 2015 | $1,670 | $46,890 | $2,380 | $44,510 |
| 2014 | $1,678 | $46,890 | $2,380 | $44,510 |
| 2013 | $1,676 | $45,010 | $2,550 | $42,460 |
Source: Public Records
Map
Nearby Homes