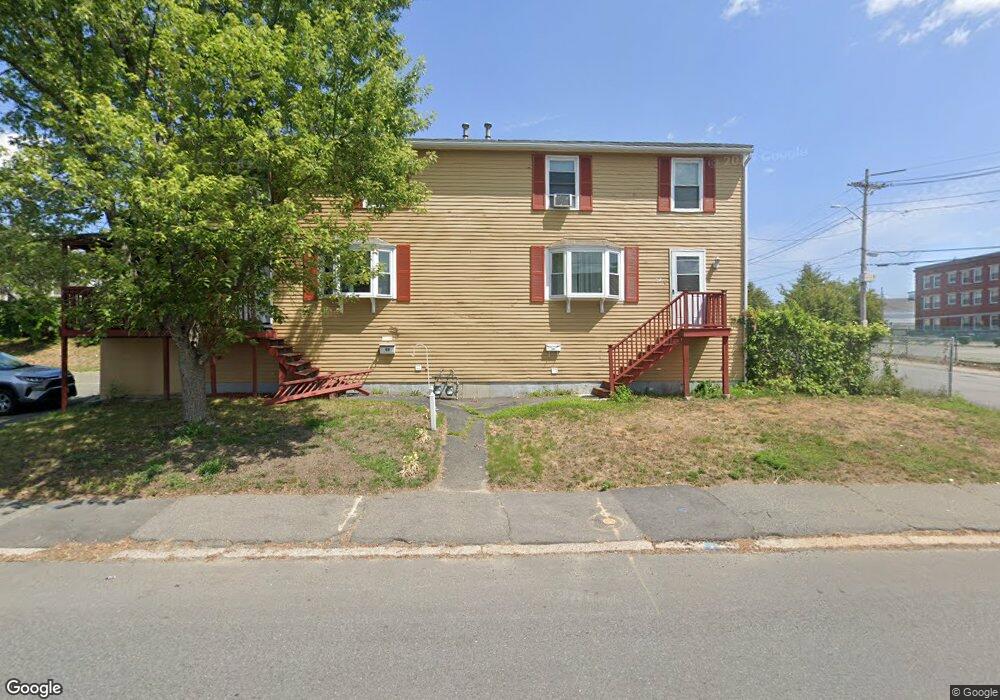
57 Primrose St Unit 1 Haverhill, MA 01830
Lower Acres NeighborhoodEstimated Value: $334,124 - $385,000
2
Beds
2
Baths
1,149
Sq Ft
$318/Sq Ft
Est. Value
About This Home
This home is located at 57 Primrose St Unit 1, Haverhill, MA 01830 and is currently estimated at $365,531, approximately $318 per square foot. 57 Primrose St Unit 1 is a home located in Essex County with nearby schools including Pentucket Lake Elementary School.
Ownership History
Date
Name
Owned For
Owner Type
Purchase Details
Closed on
Dec 16, 2009
Sold by
Fnma
Bought by
Marvin Charles D
Current Estimated Value
Home Financials for this Owner
Home Financials are based on the most recent Mortgage that was taken out on this home.
Original Mortgage
$54,800
Outstanding Balance
$35,927
Interest Rate
5%
Mortgage Type
Purchase Money Mortgage
Estimated Equity
$329,604
Purchase Details
Closed on
Nov 24, 2009
Sold by
Mccomiskie Christina
Bought by
Federal National Mortgage Association
Home Financials for this Owner
Home Financials are based on the most recent Mortgage that was taken out on this home.
Original Mortgage
$54,800
Outstanding Balance
$35,927
Interest Rate
5%
Mortgage Type
Purchase Money Mortgage
Estimated Equity
$329,604
Purchase Details
Closed on
Aug 20, 1998
Sold by
Donovan Colin and Guilmet April A
Bought by
Mccomiskie Sean R and Mccomiskie Christina
Purchase Details
Closed on
Sep 30, 1987
Sold by
Hoyt Mark
Bought by
Findley John E
Purchase Details
Closed on
Apr 30, 1987
Sold by
Hoyt Mark
Bought by
Odowd Michael C
Create a Home Valuation Report for This Property
The Home Valuation Report is an in-depth analysis detailing your home's value as well as a comparison with similar homes in the area
Home Values in the Area
Average Home Value in this Area
Purchase History
| Date | Buyer | Sale Price | Title Company |
|---|---|---|---|
| Marvin Charles D | $68,500 | -- | |
| Federal National Mortgage Association | $137,409 | -- | |
| Mccomiskie Sean R | $67,000 | -- | |
| Findley John E | $87,500 | -- | |
| Odowd Michael C | $85,000 | -- |
Source: Public Records
Mortgage History
| Date | Status | Borrower | Loan Amount |
|---|---|---|---|
| Open | Odowd Michael C | $54,800 | |
| Previous Owner | Odowd Michael C | $130,000 | |
| Previous Owner | Odowd Michael C | $105,700 |
Source: Public Records
Tax History Compared to Growth
Tax History
| Year | Tax Paid | Tax Assessment Tax Assessment Total Assessment is a certain percentage of the fair market value that is determined by local assessors to be the total taxable value of land and additions on the property. | Land | Improvement |
|---|---|---|---|---|
| 2025 | $3,352 | $313,000 | $0 | $313,000 |
| 2024 | $2,367 | $222,500 | $0 | $222,500 |
| 2023 | $2,172 | $194,800 | $0 | $194,800 |
| 2022 | $2,167 | $170,400 | $0 | $170,400 |
| 2021 | $1,906 | $141,800 | $0 | $141,800 |
| 2020 | $1,746 | $128,400 | $0 | $128,400 |
| 2019 | $1,664 | $119,300 | $0 | $119,300 |
| 2018 | $1,637 | $114,800 | $0 | $114,800 |
| 2017 | $1,469 | $98,000 | $0 | $98,000 |
| 2016 | $1,505 | $98,000 | $0 | $98,000 |
| 2015 | $1,504 | $98,000 | $0 | $98,000 |
Source: Public Records
Map
Nearby Homes
- 23 Lewis St
- 11 York St Unit 11
- 9 York St Unit 9
- 5 Kimball St
- 8 Dustin St
- 151 Franklin St
- 17 Vine St
- 192 Franklin St
- 48 Portland St
- 25-27 Dover St
- 25 Portland St
- 6 Dexter St
- 18-22 Essex St Unit 22
- 19 Washington St Unit 2
- 19 Washington St Unit 5
- 40 Bellevue Ave Unit 42
- 24 Washington St Unit 402
- 80 Wingate St Unit 4C
- 80 Wingate St Unit 3C
- 2 Washington St
- 59 Primrose St
- 57 Primrose St
- 37 Charles St
- 33 Charles St
- 47 Charles St Unit 47
- 47 Charles St
- 56 Primrose St Unit 1
- 58 Primrose St Unit 58
- 56 Primrose St Unit 56
- 49 Charles St
- 58 Primrose St
- 56 Primrose St
- 54 Primrose St Unit 54
- 54 Primrose St
- 49 Charles St Unit 5
- 33-35 Charles St
- 64 Primrose St
- 71 Primrose St Unit 3
- 71 Primrose St Unit 2
- 71 Primrose St Unit 1