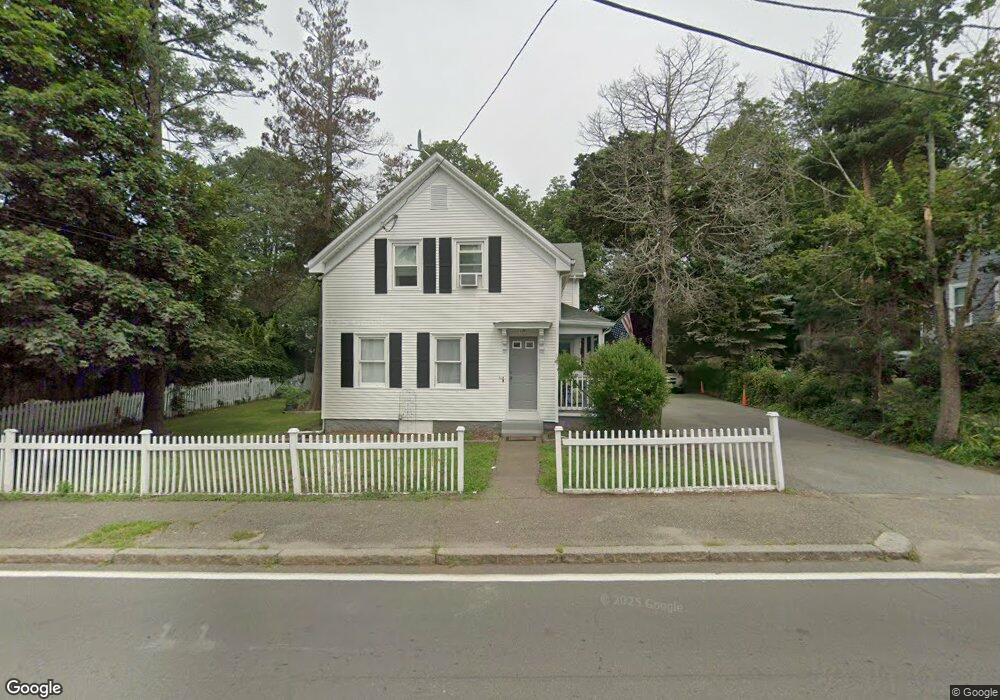
57 West St Quincy, MA 02169
South Quincy NeighborhoodEstimated Value: $722,512 - $797,000
4
Beds
2
Baths
1,434
Sq Ft
$537/Sq Ft
Est. Value
About This Home
This home is located at 57 West St, Quincy, MA 02169 and is currently estimated at $770,128, approximately $537 per square foot. 57 West St is a home located in Norfolk County with nearby schools including South West Middle School, Lincoln-Hancock Community School, and Quincy High School.
Ownership History
Date
Name
Owned For
Owner Type
Purchase Details
Closed on
Feb 29, 2012
Sold by
Nguyen Hoang and Man Wai F
Bought by
Quincy Rentals Llc
Current Estimated Value
Purchase Details
Closed on
Jun 28, 2010
Sold by
Denoy Stephen J and Denoy Lynn T
Bought by
Nguyen Hoang and Man Wai Fun
Purchase Details
Closed on
Nov 30, 2000
Sold by
Zango Erin
Bought by
Denoy Stephen J
Home Financials for this Owner
Home Financials are based on the most recent Mortgage that was taken out on this home.
Original Mortgage
$249,939
Interest Rate
7.76%
Mortgage Type
Purchase Money Mortgage
Purchase Details
Closed on
Dec 13, 1996
Sold by
White Walter C
Bought by
Barbaer Malcolm
Purchase Details
Closed on
Jun 7, 1989
Sold by
Lydon William P
Bought by
White Walter C
Create a Home Valuation Report for This Property
The Home Valuation Report is an in-depth analysis detailing your home's value as well as a comparison with similar homes in the area
Home Values in the Area
Average Home Value in this Area
Purchase History
| Date | Buyer | Sale Price | Title Company |
|---|---|---|---|
| Quincy Rentals Llc | -- | -- | |
| Quincy Rentals Llc | -- | -- | |
| Nguyen Hoang | $317,000 | -- | |
| Nguyen Hoang | $317,000 | -- | |
| Denoy Stephen J | $252,000 | -- | |
| Barbaer Malcolm | $157,000 | -- | |
| Barbaer Malcolm | $157,000 | -- | |
| White Walter C | $122,400 | -- | |
| White Walter C | $122,400 | -- |
Source: Public Records
Mortgage History
| Date | Status | Borrower | Loan Amount |
|---|---|---|---|
| Previous Owner | White Walter C | $251,000 | |
| Previous Owner | White Walter C | $249,939 |
Source: Public Records
Tax History Compared to Growth
Tax History
| Year | Tax Paid | Tax Assessment Tax Assessment Total Assessment is a certain percentage of the fair market value that is determined by local assessors to be the total taxable value of land and additions on the property. | Land | Improvement |
|---|---|---|---|---|
| 2025 | $7,309 | $633,900 | $307,600 | $326,300 |
| 2024 | $6,850 | $607,800 | $293,000 | $314,800 |
| 2023 | $6,468 | $581,100 | $266,300 | $314,800 |
| 2022 | $6,045 | $504,600 | $221,900 | $282,700 |
| 2021 | $5,675 | $467,500 | $221,900 | $245,600 |
| 2020 | $5,812 | $467,600 | $221,900 | $245,700 |
| 2019 | $5,464 | $435,400 | $209,400 | $226,000 |
| 2018 | $5,547 | $415,800 | $193,900 | $221,900 |
| 2017 | $5,230 | $369,100 | $184,600 | $184,500 |
| 2016 | $4,789 | $333,500 | $160,600 | $172,900 |
| 2015 | $4,852 | $332,300 | $160,600 | $171,700 |
| 2014 | $4,445 | $299,100 | $160,600 | $138,500 |
Source: Public Records
Map
Nearby Homes
- 42 West St
- 211 Copeland St
- 57 Buckley St
- 46-48 Buckley St
- 510 Willard St
- 14 Arthur Ave
- 46 Suomi Rd
- 46 Suomi Rd Unit 46
- 12 Arthur Ave
- 21 Arthur St
- 211 West St Unit 12B
- 91 Garfield St
- 64 Garfield St Unit B
- 52 Bunker Hill Ln
- 1 Cityview Ln Unit 506
- 1 Cityview Ln Unit 210
- 1 Cityview Ln Unit 709
- 1 Cityview Ln Unit 204
- 63 Adele Rd
- 94 Brook Rd Unit 3