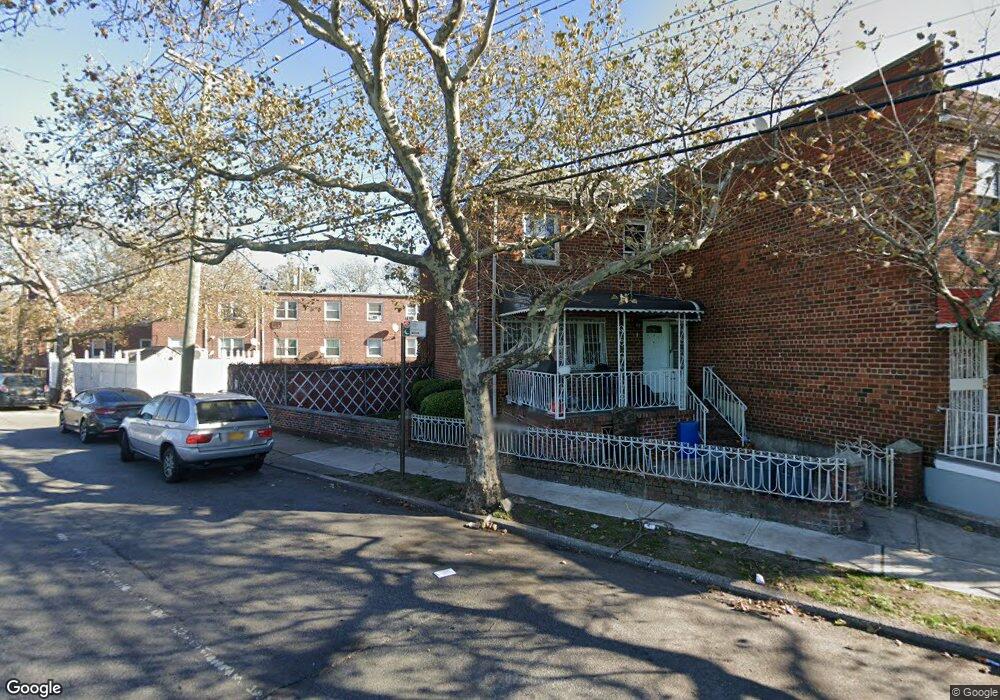
5712 Foster Ave Brooklyn, NY 11234
Flatlands NeighborhoodEstimated Value: $621,860 - $751,000
--
Bed
--
Bath
1,296
Sq Ft
$525/Sq Ft
Est. Value
About This Home
This home is located at 5712 Foster Ave, Brooklyn, NY 11234 and is currently estimated at $680,465, approximately $525 per square foot. 5712 Foster Ave is a home located in Kings County with nearby schools including P.S. 208 Elsa Ebeling, I.S. 285 Meyer Levin, and Ivy Hill Preparatory Charter School.
Ownership History
Date
Name
Owned For
Owner Type
Purchase Details
Closed on
Oct 11, 2001
Sold by
Ortanne Enterprises Ltd
Bought by
Fleming-Morris Shirley
Current Estimated Value
Home Financials for this Owner
Home Financials are based on the most recent Mortgage that was taken out on this home.
Original Mortgage
$236,292
Outstanding Balance
$91,682
Interest Rate
6.77%
Estimated Equity
$588,783
Purchase Details
Closed on
Sep 14, 2001
Sold by
Mcalister David S
Bought by
Ortanne Enterprises Ltd
Home Financials for this Owner
Home Financials are based on the most recent Mortgage that was taken out on this home.
Original Mortgage
$236,292
Outstanding Balance
$91,682
Interest Rate
6.77%
Estimated Equity
$588,783
Purchase Details
Closed on
Mar 31, 1997
Sold by
Mcalister David S
Bought by
Mcalister David S
Create a Home Valuation Report for This Property
The Home Valuation Report is an in-depth analysis detailing your home's value as well as a comparison with similar homes in the area
Home Values in the Area
Average Home Value in this Area
Purchase History
| Date | Buyer | Sale Price | Title Company |
|---|---|---|---|
| Fleming-Morris Shirley | -- | -- | |
| Fleming-Morris Shirley | -- | -- | |
| Ortanne Enterprises Ltd | -- | -- | |
| Ortanne Enterprises Ltd | -- | -- | |
| Mcalister David S | -- | -- | |
| Mcalister David S | -- | -- |
Source: Public Records
Mortgage History
| Date | Status | Borrower | Loan Amount |
|---|---|---|---|
| Open | Fleming-Morris Shirley | $236,292 | |
| Closed | Fleming-Morris Shirley | $236,292 |
Source: Public Records
Tax History Compared to Growth
Tax History
| Year | Tax Paid | Tax Assessment Tax Assessment Total Assessment is a certain percentage of the fair market value that is determined by local assessors to be the total taxable value of land and additions on the property. | Land | Improvement |
|---|---|---|---|---|
| 2025 | $5,163 | $40,320 | $11,400 | $28,920 |
| 2024 | $5,163 | $40,500 | $11,400 | $29,100 |
| 2023 | $4,909 | $38,820 | $11,400 | $27,420 |
| 2022 | $4,818 | $34,200 | $11,400 | $22,800 |
| 2021 | $5,045 | $33,540 | $11,400 | $22,140 |
| 2020 | $3,784 | $31,920 | $11,400 | $20,520 |
| 2019 | $4,433 | $30,900 | $11,400 | $19,500 |
| 2018 | $4,047 | $21,312 | $6,934 | $14,378 |
| 2017 | $4,045 | $21,312 | $9,595 | $11,717 |
| 2016 | $3,918 | $21,151 | $9,260 | $11,891 |
| 2015 | $2,590 | $19,954 | $10,526 | $9,428 |
| 2014 | $2,590 | $18,825 | $11,220 | $7,605 |
Source: Public Records
Map
Nearby Homes